
Dive deep into streamlining your development with Docker using Visual Studio. This ultimate guide provides you with essential tips and tricks for debugging applications more efficiently, ensuring a smooth, error-free development process.
C# IDEs are often compared, mainly between Visual Studio and Rider on code related features. For the use of Docker and Docker Compose, Visual Studio is far ahead of Rider in terms of the easy way to debug the code inside the container.
How does Visual Studio manage to place the debugger inside the container to enable step-by-step debugging?
That's the topic of today's article.
I won't talk much about how to generate Dockerfile and Docker Compose inside Visual Studio since that's not the topic, but here are some quick tips to do it:
- Generate the project's Dockerfile: right click on the project > Add > Docker support
- Add the project to Docker Compose: right click on the project > Add > Support Container Orchestrator > Docker Compose
Understanding how Visual Studio alters Docker Compose
A typical Docker Compose file should look like the following:
# docker-compose.yml
version: '3.4'

services:
  fakeconsole:
    image: ${DOCKER_REGISTRY-}fakeconsole
    build:
      context: .
      dockerfile: FakeConsole/Dockerfile
It starts the fakeconsole container from the FakeConsole Dockerfile project.
Nothing more is needed to be able to start the docker compose from Visual Studio. To run it, Visual Studio recognizes the docker compose inside and proposes to run it in debug :

Clicking this button will open the Output window, which starts recording the Docker Compose build.
If you take a closer look, you'll see that the saved docker-compose.yml file contains much more information than the previous one:
services:
    fakeconsole:
      build:
        context: C:\PATH
        dockerfile: FakeConsole/Dockerfile
        labels:
          com.microsoft.created-by: visual-studio
          com.microsoft.visual-studio.project-name: FakeConsole
        target: base
      container_name: FakeConsole
      entrypoint: tail -f /dev/null
      environment:
        NUGET_FALLBACK_PACKAGES: /root/.nuget/fallbackpackages
      image: fakeconsole:dev
      labels:
        com.microsoft.visualstudio.debuggee.arguments: ' --additionalProbingPath /root/.nuget/packages
          --additionalProbingPath /root/.nuget/fallbackpackages  "/app/bin/Debug/net7.0/FakeConsole.dll"'
        com.microsoft.visualstudio.debuggee.killprogram: /bin/sh -c "if PID=$$(pidof
          dotnet); then kill $$PID; fi"
        com.microsoft.visualstudio.debuggee.program: dotnet
        com.microsoft.visualstudio.debuggee.workingdirectory: /app
      tty: true
      volumes:
      - C:\PATH\FakeConsole:/app:rw
      - C:\Users\Pierre\vsdbg\vs2017u5:/remote_debugger:rw
      - C:\Program Files (x86)\Microsoft Visual Studio\Shared\NuGetPackages:/root/.nuget/fallbackpackages:ro
      - C:\Users\Pierre\.nuget\packages:/root/.nuget/packages:ro
      - C:\PATH:/src:rw
It's pretty interesting!
Fields are added, some more important than others.
build contains 2 new pieces of information: labels to add tags to the image, which do not alter the image, only adding Visual Studio tags (Microsoft is diabolic😈), and target to select the stop step while building the image.
  build:
    context: C:\PATH
    dockerfile: FakeConsole/Dockerfile
    labels:
      com.microsoft.created-by: visual-studio
      com.microsoft.visual-studio.project-name: FakeConsole
    target: base
The content of Dockerfile allows to understand how steps are declared. A step is a specific name associated to an image with the keyword AS. In our case, it contains 4 steps: base, build, publish and final.
FROM mcr.microsoft.com/dotnet/runtime:7.0 AS base
WORKDIR /app

FROM mcr.microsoft.com/dotnet/sdk:7.0 AS build
WORKDIR /src
COPY ["FakeConsole/FakeConsole.csproj", "FakeConsole/"]
RUN dotnet restore "FakeConsole/FakeConsole.csproj"
COPY . .
WORKDIR "/src/FakeConsole"
RUN dotnet build "FakeConsole.csproj" -c Release -o /app/build

FROM build AS publish
RUN dotnet publish "FakeConsole.csproj" -c Release -o /app/publish /p:UseAppHost=false

FROM base AS final
WORKDIR /app
COPY --from=publish /app/publish .
ENTRYPOINT ["dotnet", "FakeConsole.dll"]
Dockerfile integrates a step management to allow developers to partially build an image, very practical in this case. The final image produces an image with all files compiled in release mode, which does not allow to be in debug mode. To avoid this, Visual Studio blocks the building of the image from the beginning to be sure that the files are not compiled.
In this case, the base target step creates a completely empty container with only the runtime for .NET 7.0.
This is the reason why Visual Studio also adds volumes to access local files. It accesses several folders: the remote debugger, packages, project files and context. There is a link at the end of the article if you want to go deeper into this explanation.
  volumes:
  - C:\PATH\FakeConsole:/app:rw
  - C:\Users\Pierre\vsdbg\vs2017u5:/remote_debugger:rw
  - C:\Program Files (x86)\Microsoft Visual Studio\Shared\NuGetPackages:/root/.nuget/fallbackpackages:ro
  - C:\Users\Pierre\.nuget\packages:/root/.nuget/packages:ro
  - C:\PATH:/src:rw
Finally, it launches the visual studio debugger inside the container with labels starting with com.microsoft.visualstudio.debuggee.
  labels:
    com.microsoft.visualstudio.debuggee.arguments: ' --additionalProbingPath /root/.nuget/packages
      --additionalProbingPath /root/.nuget/fallbackpackages  "/app/bin/Debug/net7.0/FakeConsole.dll"'
    com.microsoft.visualstudio.debuggee.killprogram: /bin/sh -c "if PID=$$(pidof
      dotnet); then kill $$PID; fi"
    com.microsoft.visualstudio.debuggee.program: dotnet
    com.microsoft.visualstudio.debuggee.workingdirectory: /app
The command can be easily deduced: dotnet /app --additionalProbingPath /root/.nuget/packages --additionalProbingPath /root/.nuget/fallbackpackages.
All these updates allow Visual Studio to enable debug mode directly inside the container, linking local files to containerized files.
How Visual Studio generates an updated Docker Compose?
The content of docker-compose was not the only important information in the output. Just above, the docker-compose command line is also called:
docker-compose -f "C:\PATH\docker-compose.yml" -f "C:\PATH\obj\Docker\docker-compose.vs.debug.g.yml" -p dockercompose14380014310429482373 --ansi never config
Um, where do the docker-compose.vs.debug.g.yml files come from?
Obviously, Visual Studio can't change the docker-compose directly, otherwise there would be a permanent rewrite between what the developer wants to configure and what Visual Studio needs to have to run debugging on the container.
Instead, Visual Studio creates its own docker-compose overload called docker-compose.vs.debug.g.yml compiled at each docker-compose startup, and saves them in the obj folder in the context (the place where you have the docker-compose).
Docker compose allows multiple files to be called, where the one after it can override the one before it, especially to allow in this case to override the debugging configuration.
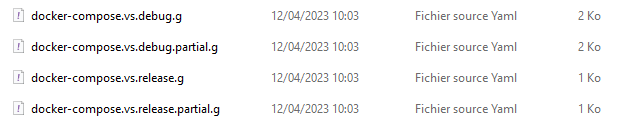
The path C:\PATH\obj\Docker shows more than one file created.
Depending on the configuration in which the docker-compose is started, Visual Studio will call the corresponding configuration. To check this, here are the contents of the docker-compose.vs.debug.g.yml file.
services:
  fakeconsole:
    image: fakeconsole:dev
    container_name: FakeConsole
    build:
      target: base
      labels:
        com.microsoft.created-by: "visual-studio"
        com.microsoft.visual-studio.project-name: "FakeConsole"
    environment:
      - NUGET_FALLBACK_PACKAGES=/root/.nuget/fallbackpackages
    volumes:
      - C:\PATH\FakeConsole:/app:rw
      - C:\Users\Pierre\vsdbg\vs2017u5:/remote_debugger:rw
      - C:\Program Files (x86)\Microsoft Visual Studio\Shared\NuGetPackages:/root/.nuget/fallbackpackages:ro
      - C:\Users\Pierre\.nuget\packages:/root/.nuget/packages:ro
      - C:\PATH:/src:rw
    entrypoint: tail -f /dev/null
    labels:
      com.microsoft.visualstudio.debuggee.program: "dotnet"
      com.microsoft.visualstudio.debuggee.arguments: " --additionalProbingPath /root/.nuget/packages --additionalProbingPath /root/.nuget/fallbackpackages  \"/app/bin/Debug/net7.0/FakeConsole.dll\""
      com.microsoft.visualstudio.debuggee.workingdirectory: "/app"
      com.microsoft.visualstudio.debuggee.killprogram: "/bin/sh -c \"if PID=$$(pidof dotnet); then kill $$PID; fi\""
    tty: true
It's exactly the new lines that we find in our docker-compose file. Great!
The last question might be: If I want to change the generated values, how can I do it?
Microsoft has foreseen this case, and allows to create an `docker-compose.vs.debug.yml` (without the .g) file at the root of the docker compose to overload the generated values. It may be useful to remove the com.microsoft.created-by tag to set yourself as the creator 😈.
Summary
There is no magic to enable the debugger inside the container. Visual Studio overrides the configuration by getting a non-final image to access the files, then it creates a link between the local folder and the containerized folder.
To go further, dive into the Microsoft documentation below:
Have a goat day 🐐
Join the conversation.