
Jumping into a new codebase is never easy. It takes time, patience, and often a fair bit of frustration. And when the codebase is legacy — undocumented, inconsistent, and complex — the challenge grows infinitely...
In this article, based on the work we've done with my colleague Alexandre Trigueros for our workshop "Jurassic Code: Taming the Dinosaurs of Legacy Code", I want to share an approach that has helped me a lot: Outside-In Discovery.
We'll explore what it is, why it helps, and how to apply it effectively when you're dropped into unfamiliar territory — whether you're onboarding to a new team or "auditing" a system.
The Problem
Let’s face it — no one really taught us how to explore an unfamiliar codebase. Not in school. Not during bootcamps. Not even in most companies.
And yet, it's a core activity of our work. Studies estimate that we spend up to 60% of our time reading code — trying to understand a colleague’s work, diving into an internal project, or exploring an open source repository.
Still, we treat this as a side effect of development rather than a skill to cultivate.
But what if it wasn't just a painful necessity?
What if getting better at navigating code could increase our efficiency and reduce our cognitive load?
Before I share how I’m working on it, I’d like to invite you to pause for a moment.
Grab a piece of paper (yes, I’m a little old school) and answer this simple question:
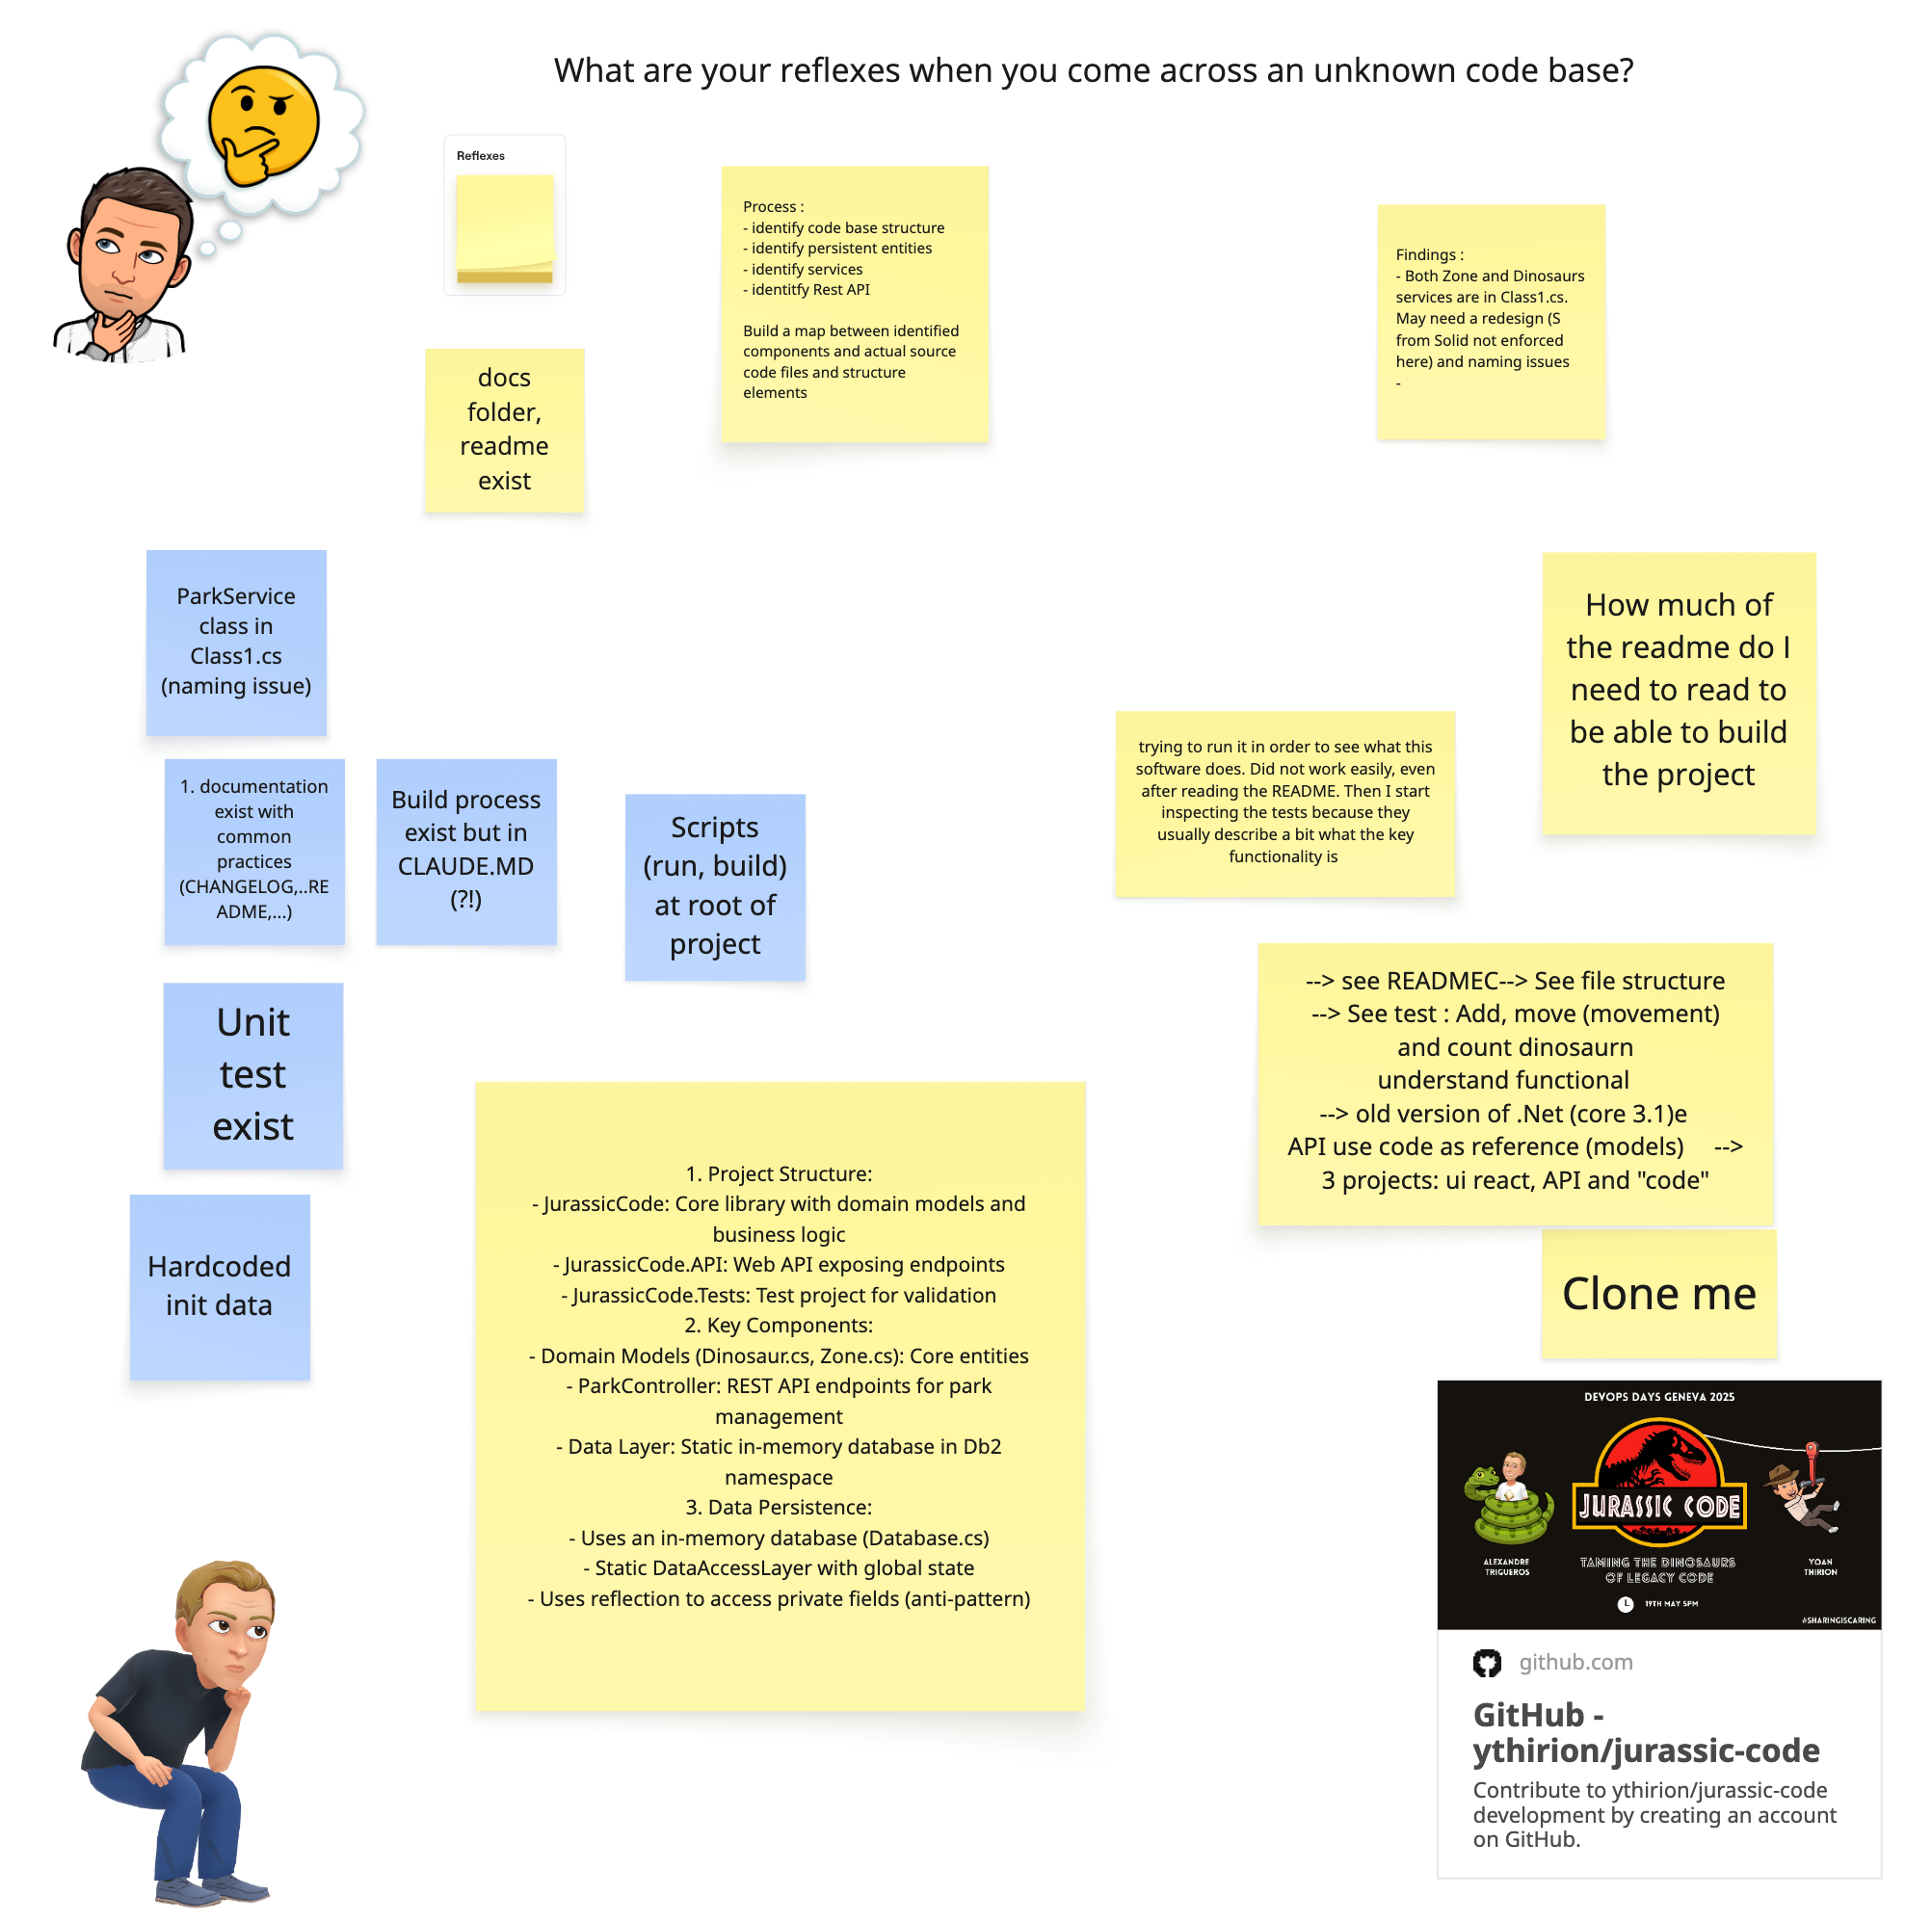
What are your reflexes when you come across an unknown codebase?
What do you look for first?
Where do you click?
What makes you feel lost?
Write down your thoughts.
Introducing Outside-In Discovery
Over the years, I’ve developed a personal checklist that helps me quickly gather meaningful insights when facing a new codebase. I call it: Outside-In Discovery.
Think of it as a structured walkthrough — a repeatable process to reduce overwhelm and focus your attention where it matters most.
Why a checklist?
Because checklists act as a second brain.
When we're confronted with cognitive overload — which happens a lot when diving into unfamiliar code — a checklist helps us stay grounded.
It reduces decision fatigue, ensures we don’t skip important steps, and creates space for deeper thinking.
What is Outside-In Discovery?
It is a technique allowing us to explore a codebase layer by layer — from the outside to the inside:
Outside: Start with everything visible without diving into the codeREADME- Git history
- CI/CD pipelines
- Project boards (Jira for example 🤢)
- etc.
Inside: Gradually work your way toward the actual code- Folder structure
- Entry points
- Business logic
- Tests
- Core logic
- etc.
This approach mirrors how we naturally explore unfamiliar territory: by first observing the surface, then stepping in deeper as we build confidence.
A Time-Boxed Exploration
When I do this, I behave as if I were a new joiner in the team — someone trying to get up to speed, fast.
I time-box the review to one hour max.
The goal isn’t to understand everything, but to answer a few essential questions:
- How easy is it to onboard?
- What frictions do I encounter?
- Where do I feel lost, and where do things feel intuitive?
That feeling — of flow or friction — gives me strong signals about the health of the codebase and its developer experience.
Outside-In Discovery by Example
I’ll walk you through each part of my approach using an example: the codebase available at https://github.com/ythirion/jurassic-code.
I invite you to follow along and try it on your own current project.
Read the Documentation (a.k.a RTFM)
My first reflex is to look for a README.md or any form of documentation.
Why? Because these files are meant to answer your most immediate questions:
- What is this project about?
- How do I run it?
- What are its main features?
- Where can I find more information?
A well-written README can save hours of wandering through folders and files.
In our case?
Pretty quick here — there is none (nor CI pipelines).
This tells us a lot already:
- There may be an onboarding friction for new developers.
- The development team might rely on tacit knowledge.
- We’ll need to fall back on other artifacts (like the folder structure, build scripts, or commit history) to start making sense of the system.
Lack of documentation is a signal in itself. It tells you something about the developer experience and culture behind the codebase.
Look at the Git Log
When exploring a new codebase, looking at the Git history can be surprisingly insightful.
Why check the Git log?
Because it tells the story of the project:How actively is it maintained?Who contributes and how often?Are commit messages meaningful or cryptic?Can you trace the origin of a piece of logic?Do changes appear small and focused, or chaotic?
In a real-world system, this step often surfaces:
- Code ownership patterns (who touches what),
- Areas of frequent churn (which can hint at hotspots),
- Refactoring intentions,
- Abandoned features or tech migrations.
In our case?
This codebase is part of a workshop — so the Git log isn’t very relevant here...
Think of the Git log as the project’s black box — it records every decision, mistake, and fix. Use it.
Compile the Code
The next step is to check if we can build and run the project — ideally with minimal friction. This step serves multiple purposes:
- It validates the setup instructions (if any exist),
- It reveals early issues like missing dependencies or deprecated tech,
- And it gives you a feel for how the team has (or hasn't) automated the developer experience.
We can think of compilation as our “first handshake” with the codebase.
In our case?
To get things going, here’s what we can do:
# There is dotnet solution
dotnet build JurassicCode.sln
# And a front-end app
npm install --prefix jurassic-ui
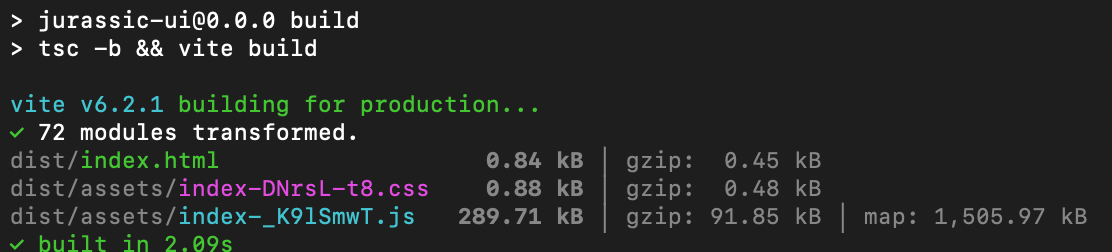
npm run build --prefix jurassic-uiBuild script
Here are the results:
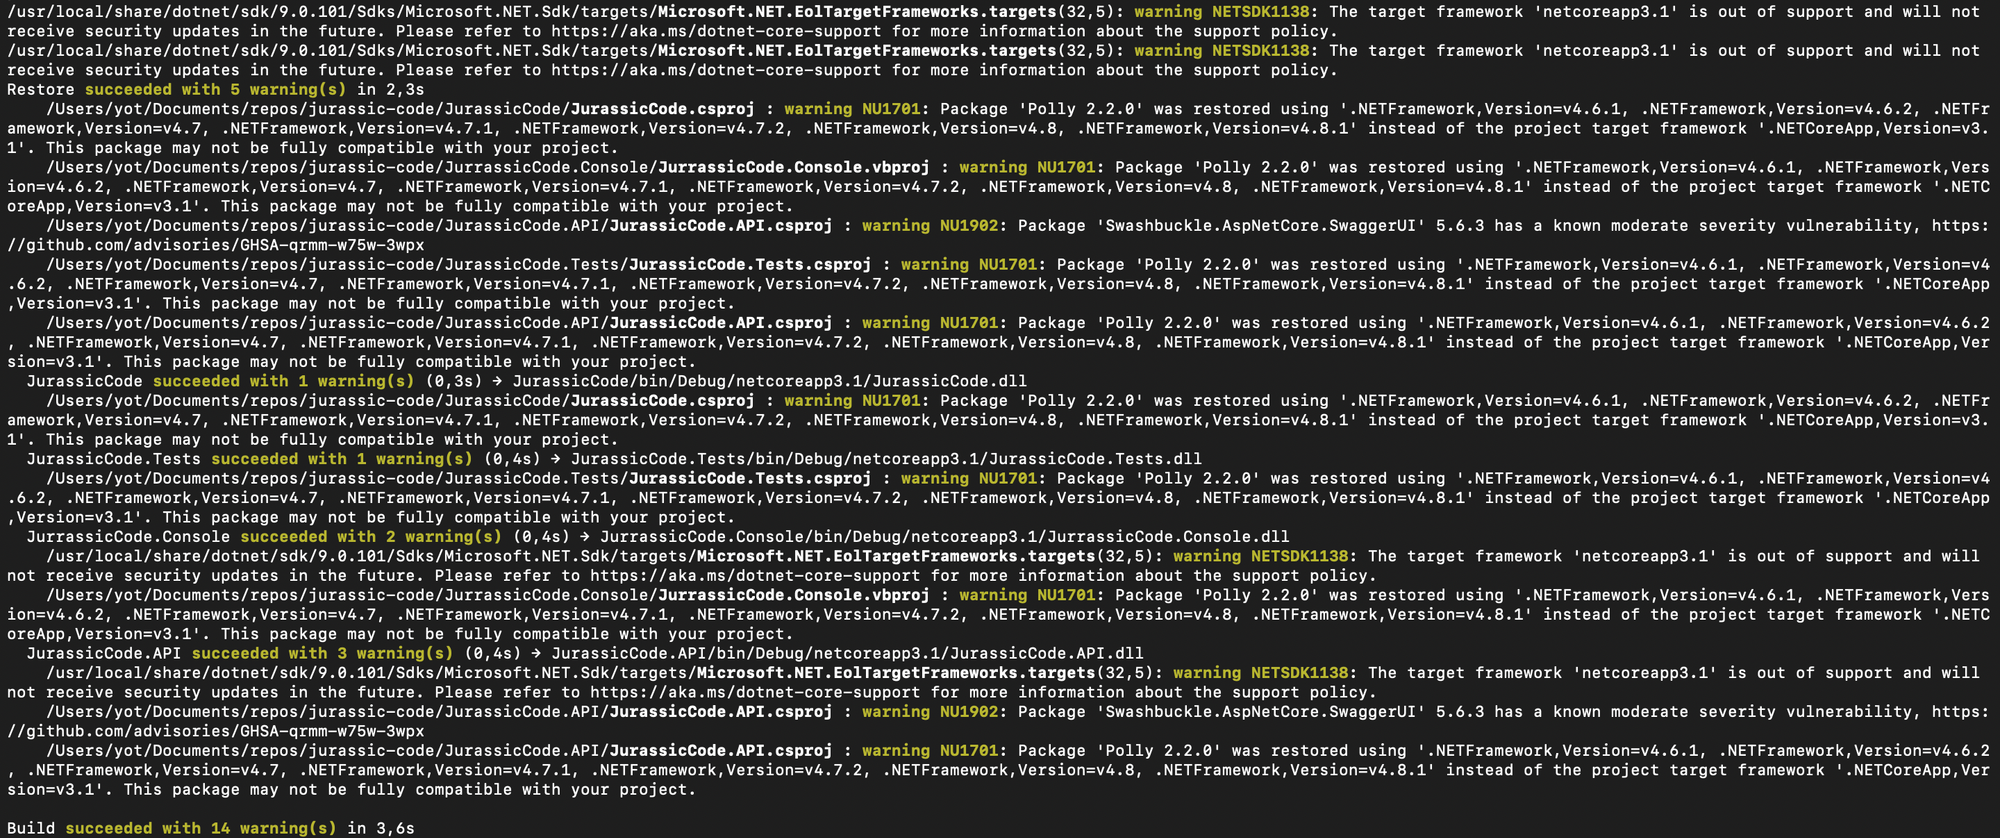
- Back-end (C#) : the back-end compiles… but not without a few warnings
- This already raises some flags — we’ll explore those in the next step.
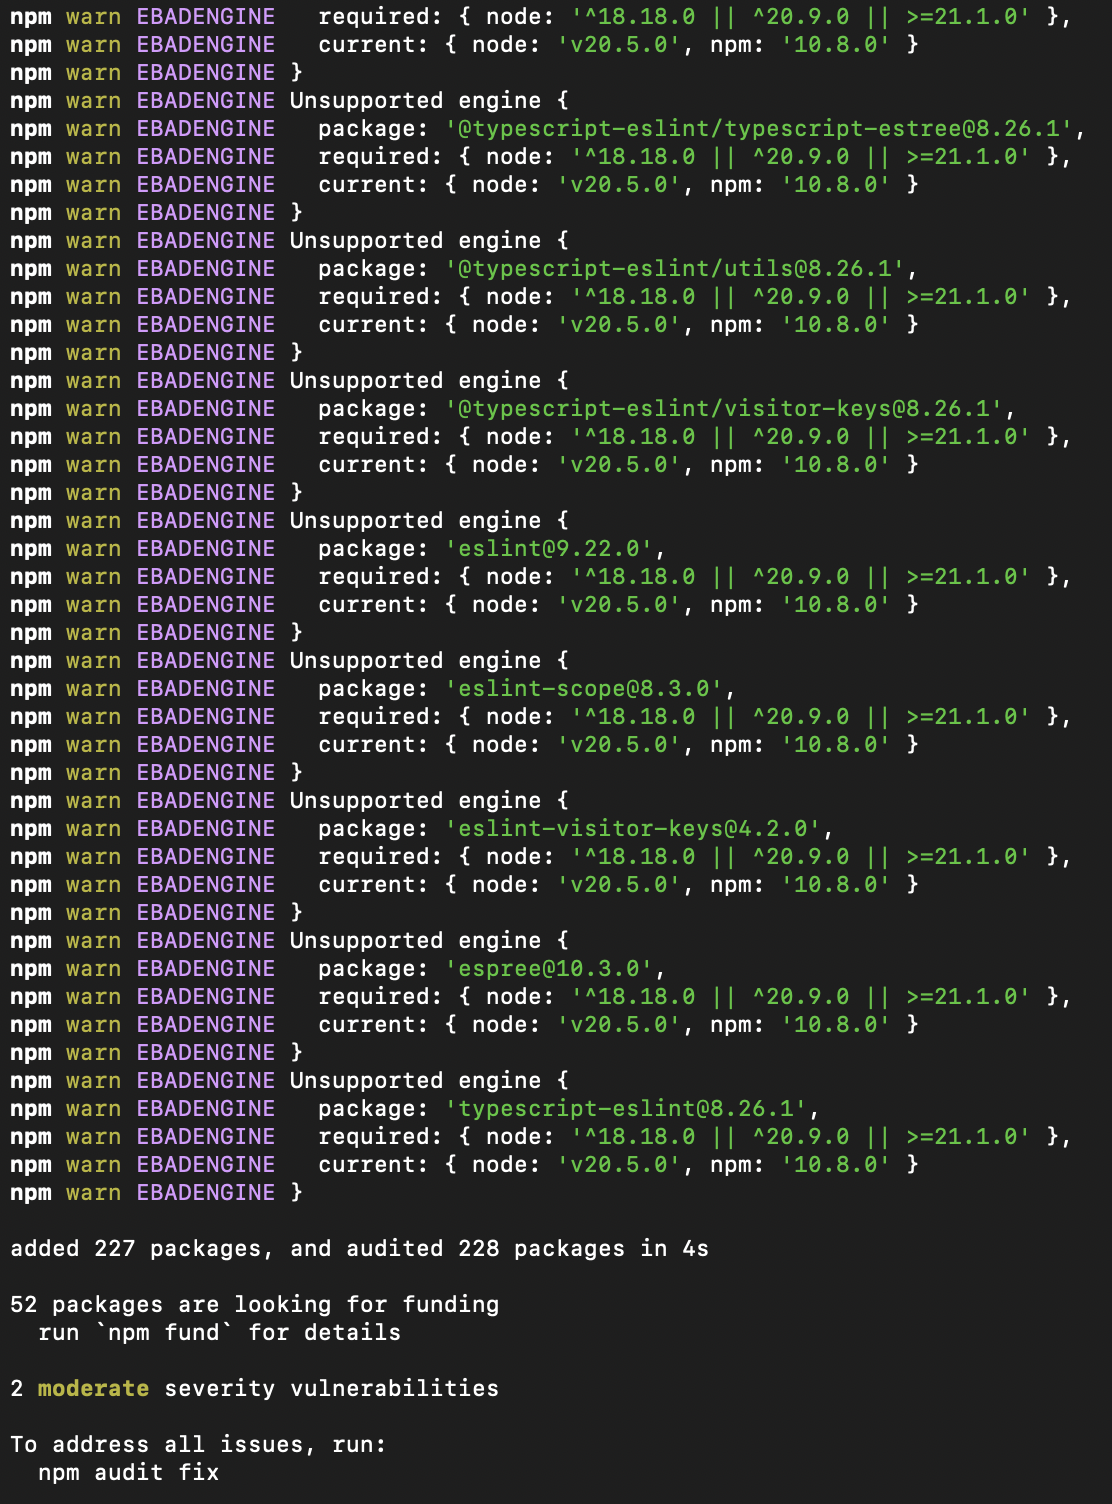
- Front-end (TypeScript)
- The build does succeed, but again, not cleanly:
npm installcompletes, but returns a some vulnerabilities:
Key takeaways
- The system builds — that's a good start!
- The presence of warnings and security issues is an early indicator of tech debt.
- This step helps you gauge how welcoming the codebase is for a newcomer. If you’re stuck here, everything else becomes harder.
As a rule of thumb: A clean build builds trust.
Analyze Compilation Warnings
Once the code compiles, don’t stop there. Warnings are signals, and they're often trying to tell you something important about the health and future-proofing of the codebase.
Let’s take a look at what came up during the build.
Deprecated Frameworks
One of the first things we notice is the use of an outdated .NET version:
Microsoft.NET.EolTargetFrameworks.targets(32,5): Warning NETSDK1138 : The target framework 'netcoreapp3.1' is out of support and will not receive security updates in the future.
More info on the .NET support policy
It means:
- The project isn’t on a maintained or secure framework.
- Any updates or improvements will become increasingly painful.
- Future onboarding of new developers could be blocked by missing runtime support or tooling.
Vulnerabilities in Dependencies
We also see vulnerabilities flagged in both the front-end (ui) and back-end (api) dependencies:
- Some may be minor (e.g. dev-time only),
- Others might introduce security or stability issues.
These warnings are often ignored — until they’re not (remember log4j 😉).
Surfacing them early helps drive conversations about dependency hygiene and risk management.
Tech Stack Complexity
Another interesting observation: the system mixes multiple languages and paradigms:
C#(modern)VB.NET(legacy?)TypeScript(frontend)
This may suggest:
- A gradual migration from older tech (e.g. VB.NET),
- Or a patchwork of different development eras and styles.
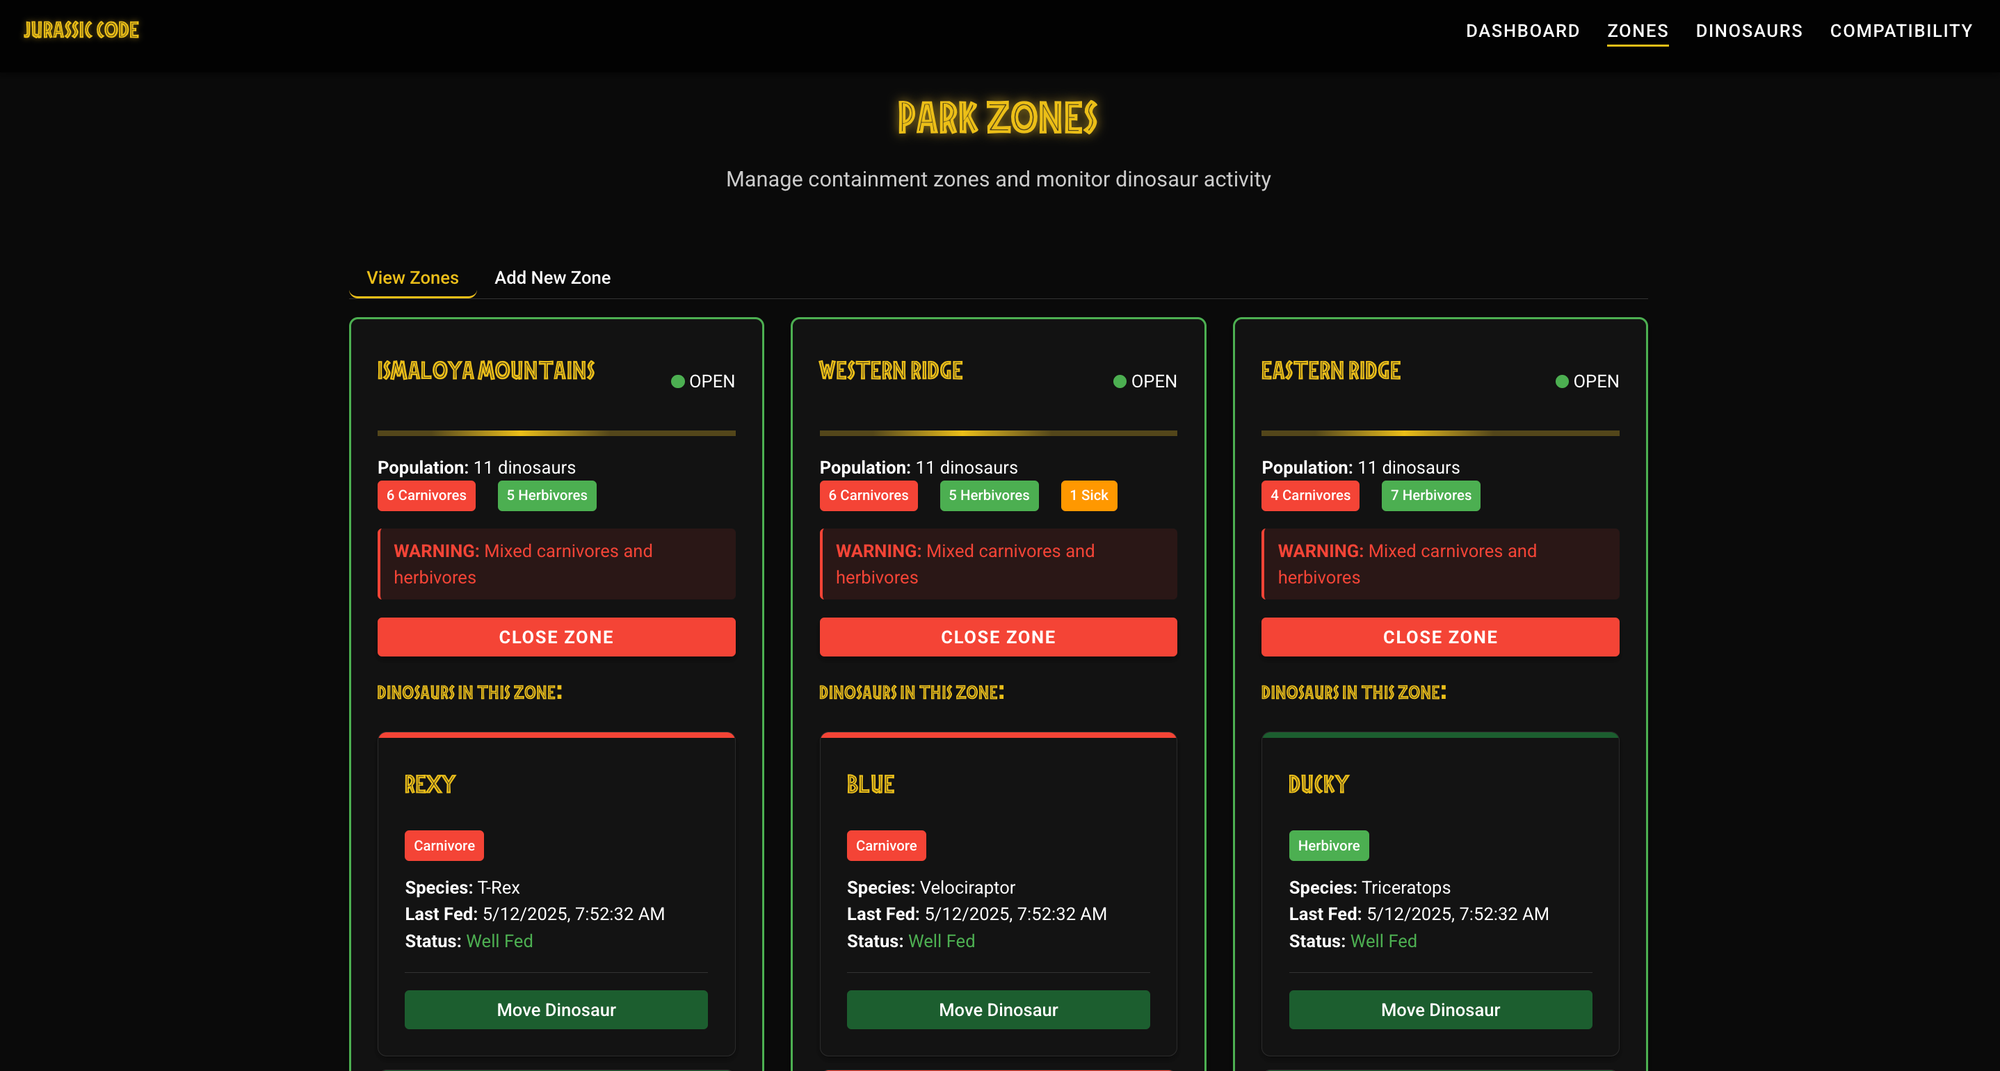
Explore the UI to Understand the System's Features
If the app has a user interface, use it.
It’s often the fastest way to grasp the business context and supported use cases.
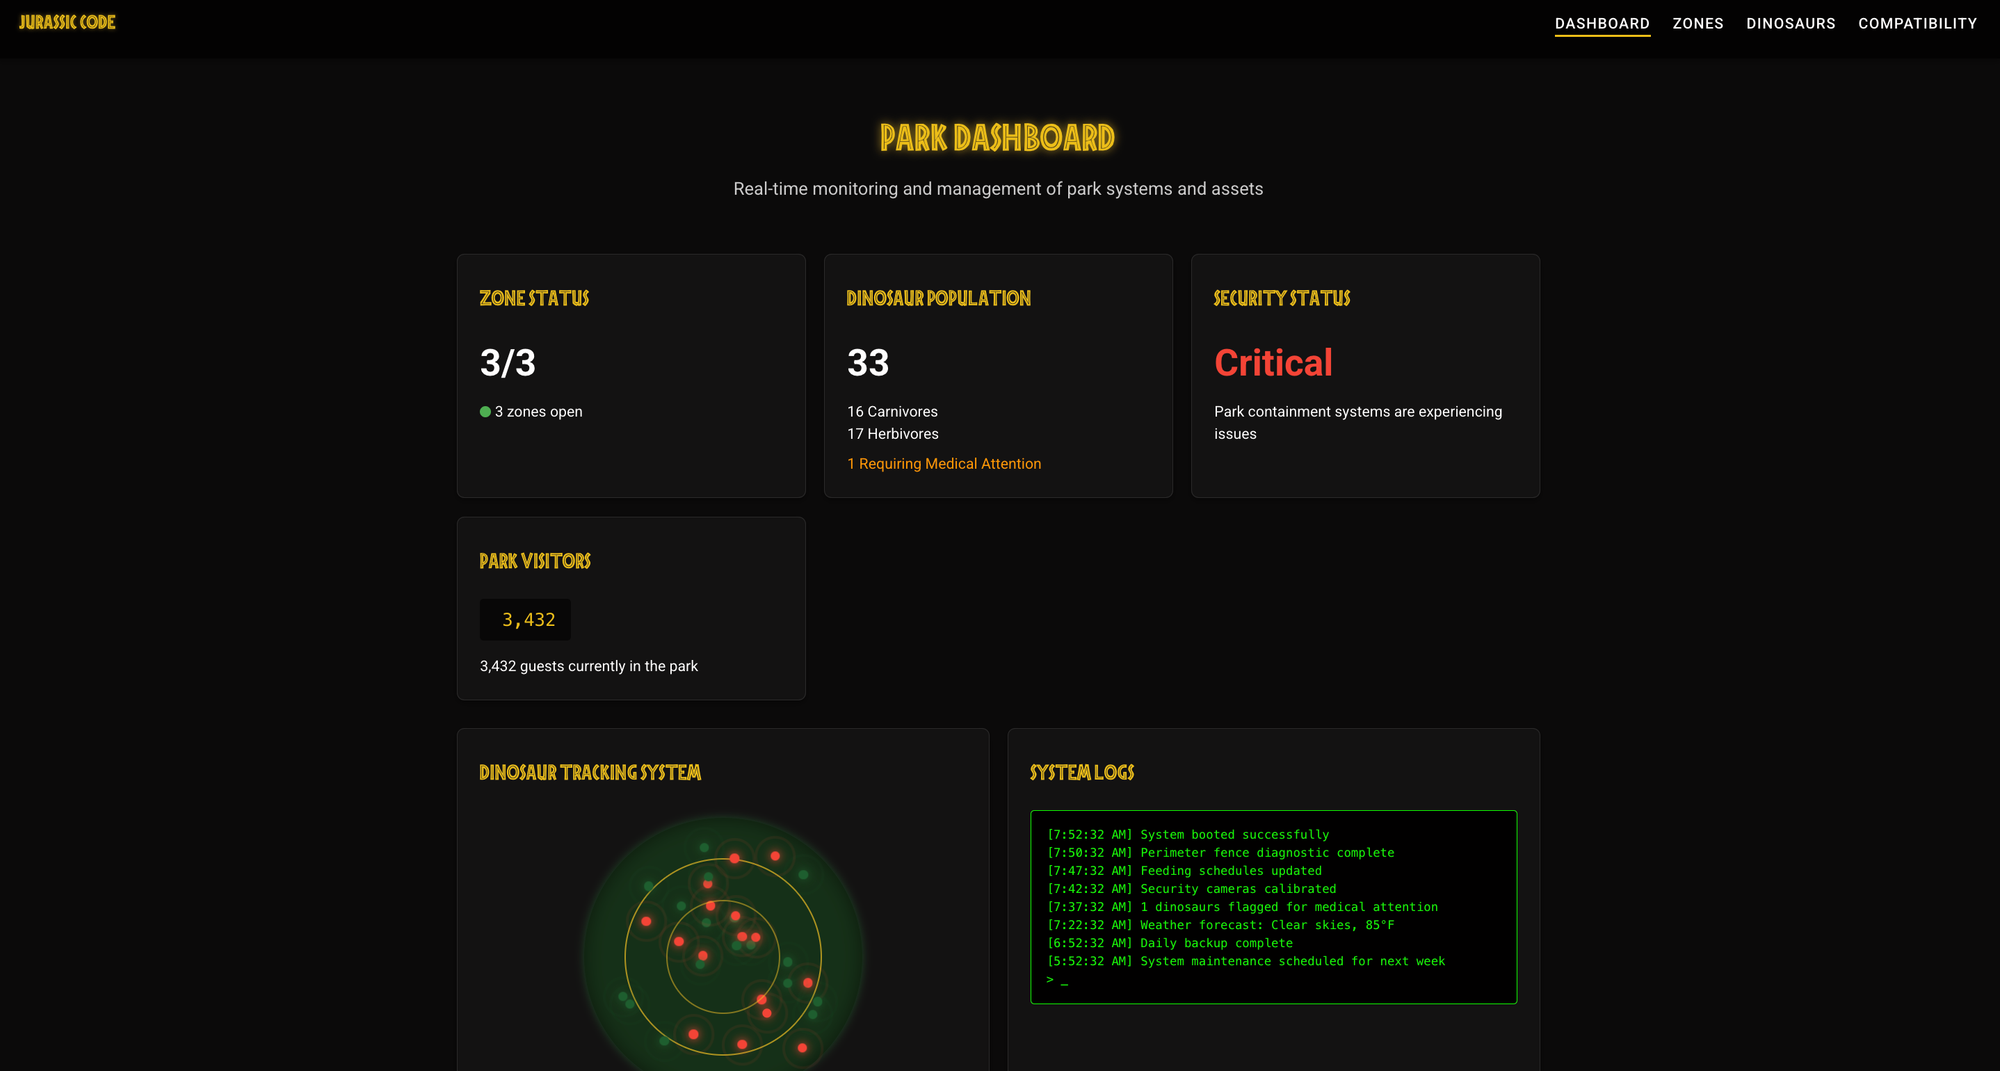
Here’s what we observed by launching the front-end and playing with the application:
- Visualize the global state of the Jurassic Park through a dashboard
- Create zones to organize dinosaurs
- Assign or remove dinosaurs from a zone
- Check compatibility between two dinosaur species
- Close a zone (presumably for safety or maintenance)
- Visualize health status of all dinosaurs in the park
These insights give us immediate context and make the codebase much easier to read and interpret later.
Analyze the Code Structure
After experiencing the app, we look at how the code is laid out:
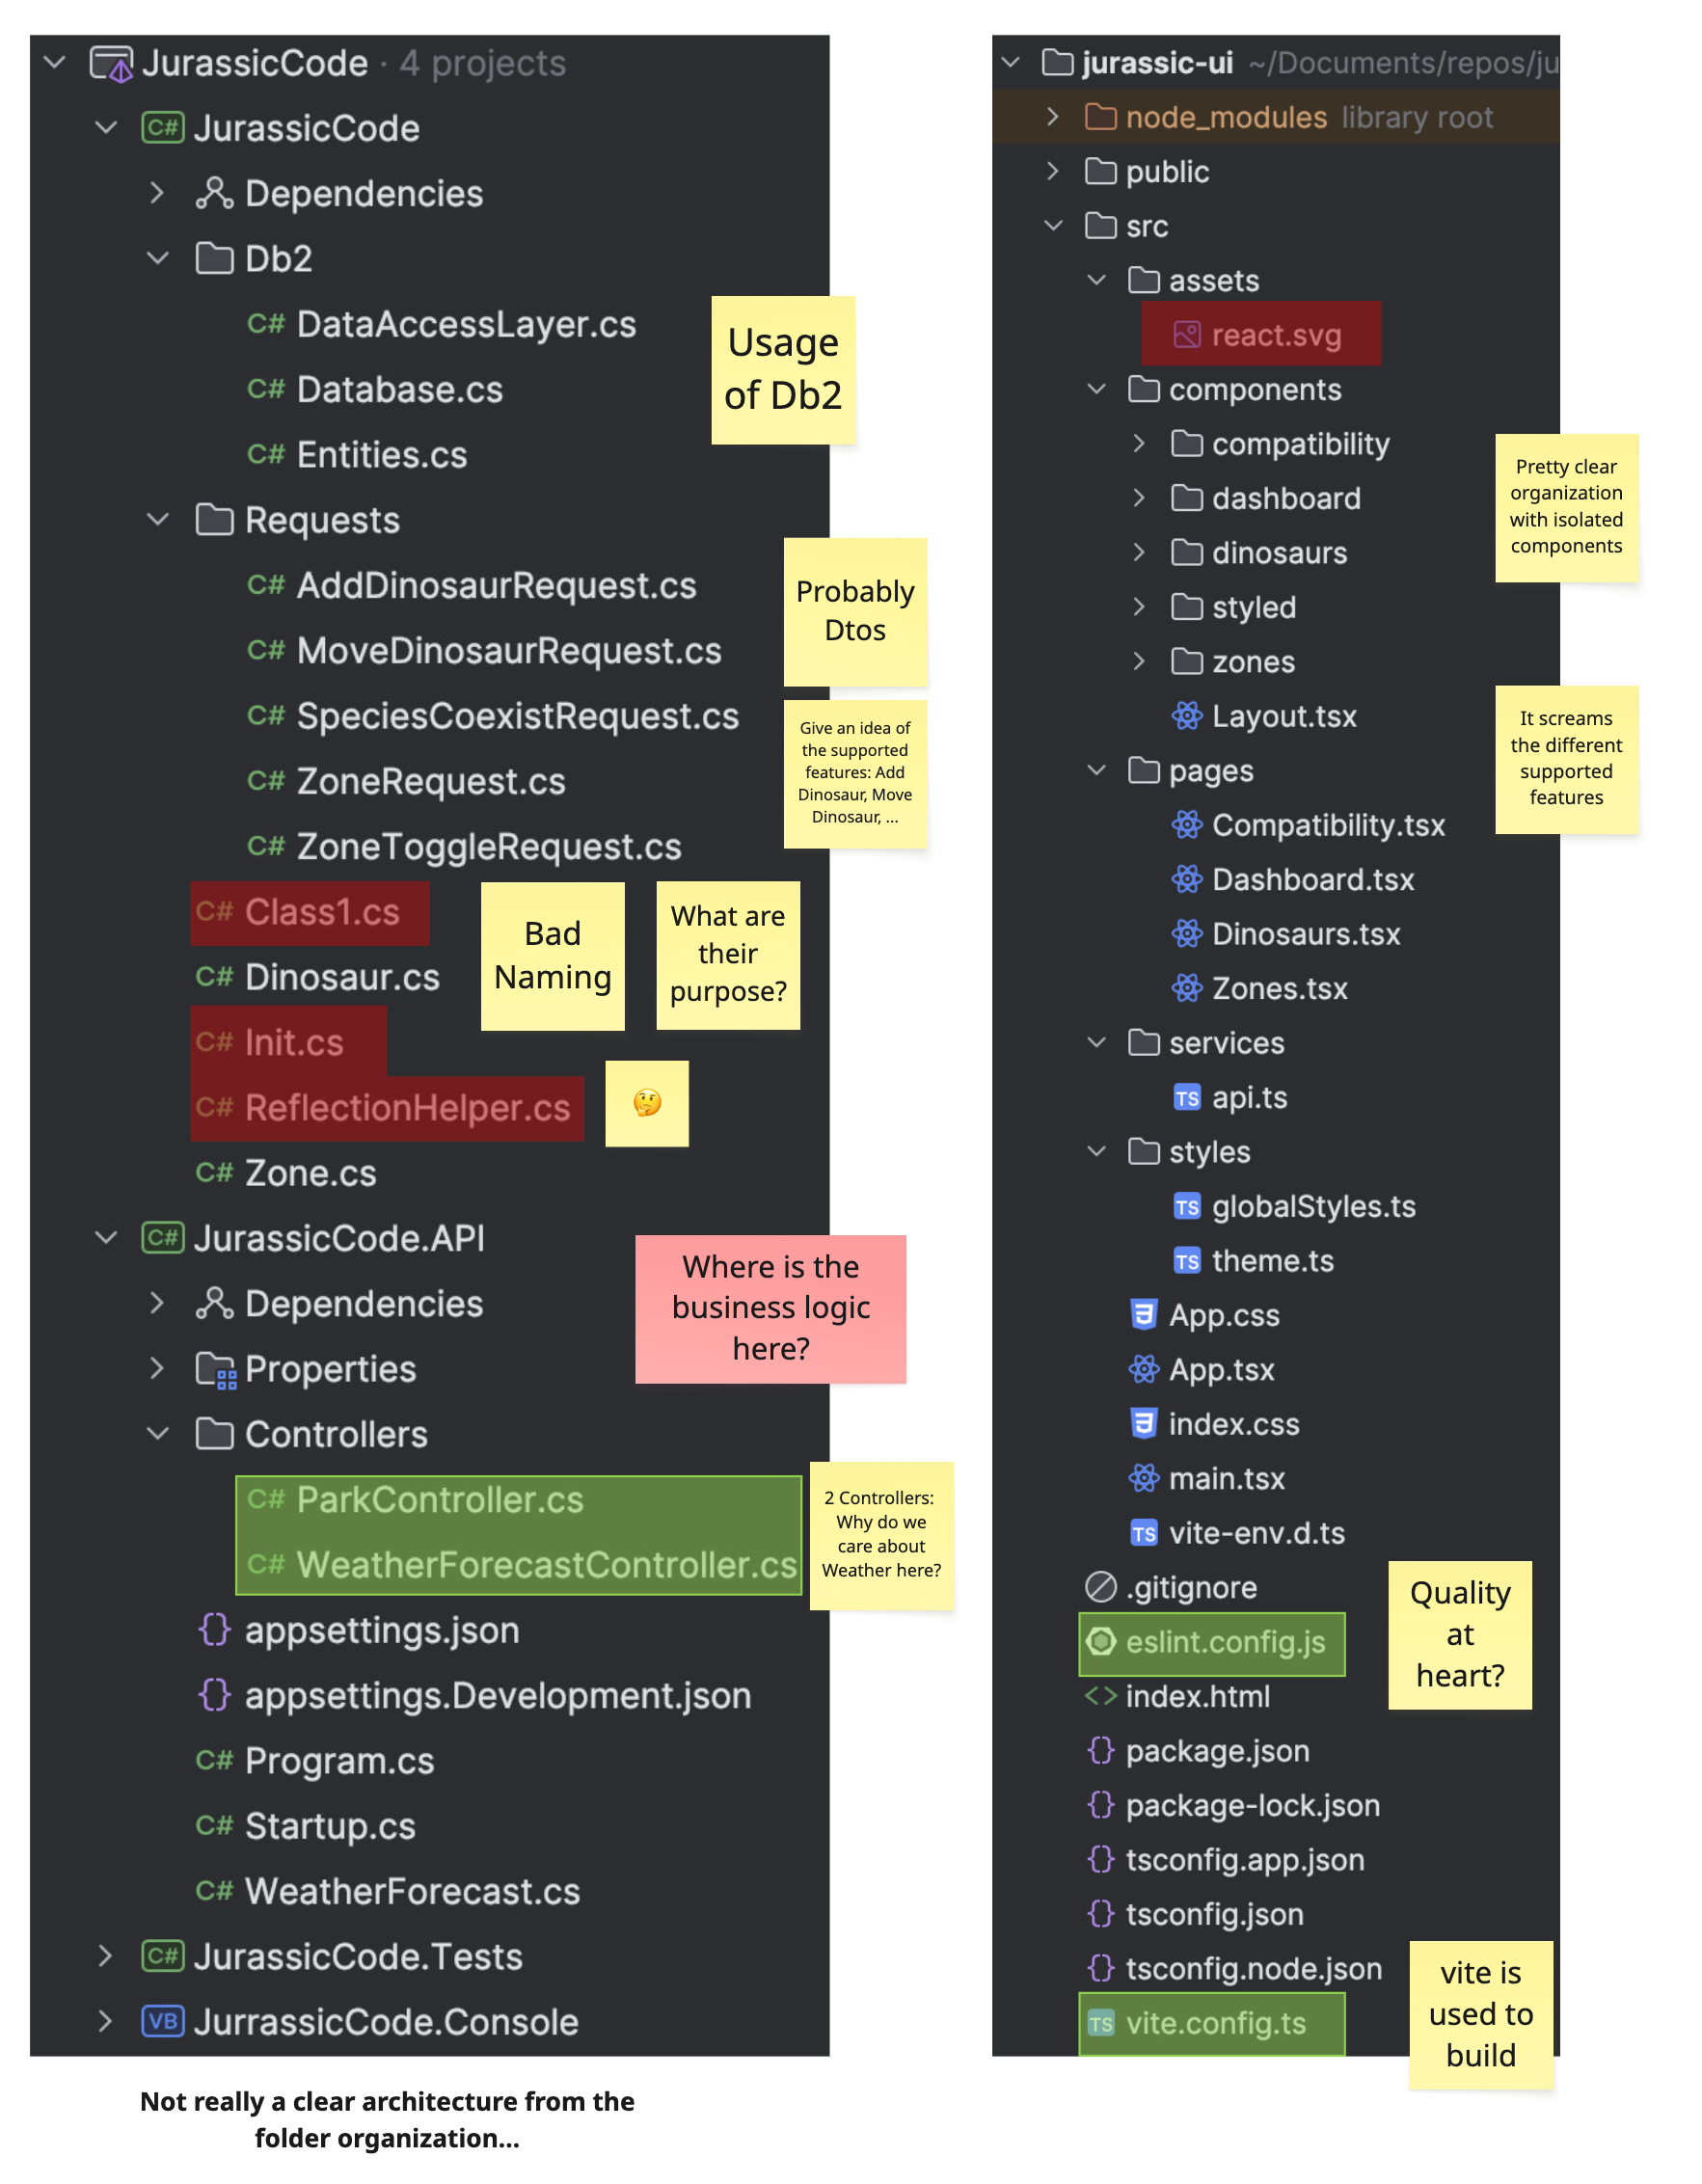
On the back-end side:
- Only two controllers:
ParkControllerand…WeatherForecastController- Why is weather forecasting relevant to a Jurassic Park system?
- The presence of
Dtos(e.g.AddDinosaurRequest) helps us map frontend actions to backend endpoints. - Business logic is unclear or scattered — we’re missing a strong architectural structure.
- The use of a
ReflectionHelperraises questions... - Poor naming conventions (
Class1,Init) make the system harder to explore. - The database backend appears to be
Db2.
A clean folder structure is often a reflection of clean thinking.
Here, we get the sense that things were built quickly or iteratively without strong architectural boundaries.
On the front-end side:
- Components are well isolated and named — that’s a good sign.
- Use of
eslintsuggests an effort toward code quality. - Use of
vitegives us fast builds and modern tooling.
Combining user-facing exploration with structural analysis gives you both the what and the how of the system — a crucial pair for building mental models.
Check Dependencies to Understand System Interactions
Understanding a system’s dependencies gives you a glimpse into:
- What external tools, libraries, or services it relies on,
- How it communicates (e.g. APIs, messaging systems),
- And how up-to-date or risky its foundation is.
Dependencies shape the boundaries and behaviors of the system.
They also reveal the architectural decisions and trade-offs made by the team.
Back-End Dependencies
We start by listing all NuGet packages used in the .NET solution:
dotnet list JurassicCode.sln package
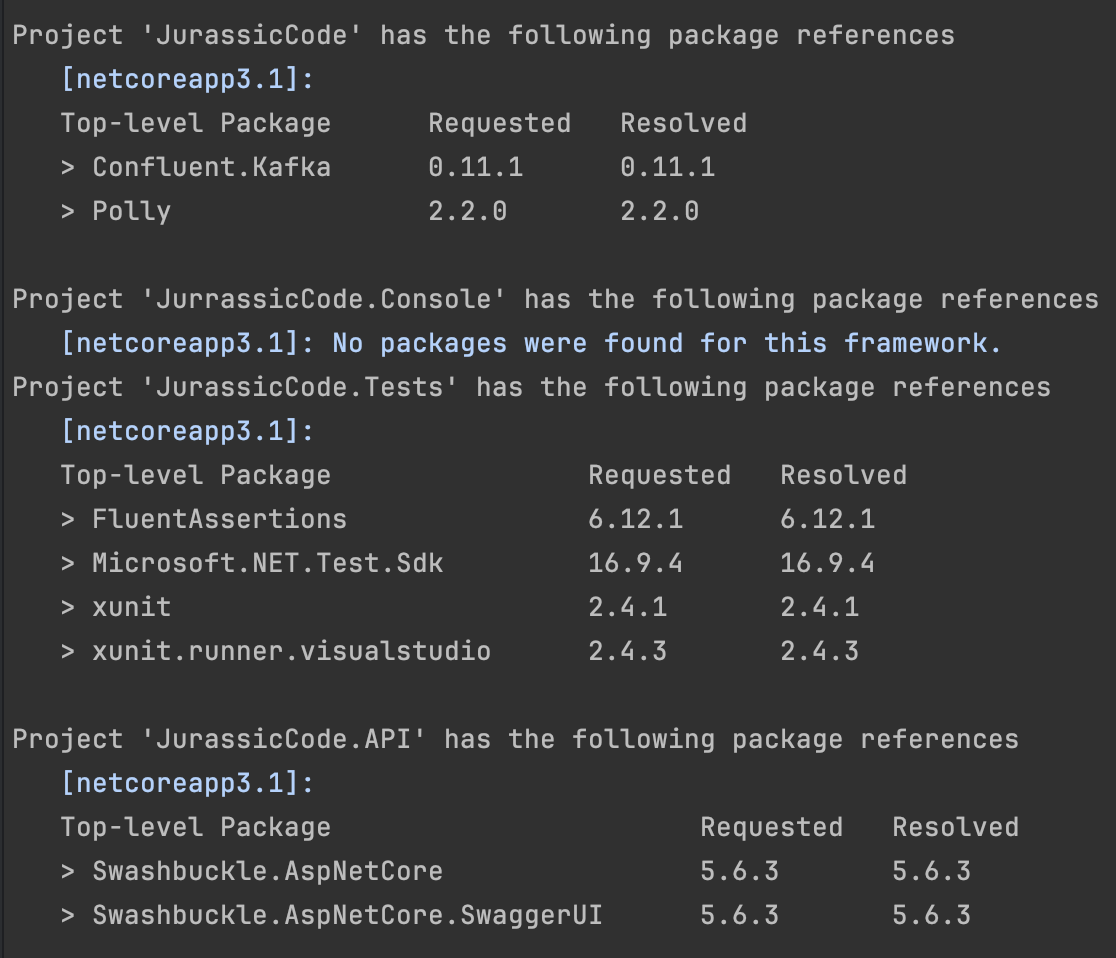
Here’s what stands out:
Confluent.Kafka: the system integrates with Kafka — possibly for messaging between services or event-driven workflows.Polly: used for resilience — perhaps for retry policies, timeouts, or circuit breakers.Swashbuckle.AspNetCore: indicates the API is documented using OpenAPI / Swagger — good for both onboarding and integrations.FluentAssertions: makes tests more readable and expressive — a nice touch for maintainability.
Weird stuff: There’s no visible Db2 connector, although the code references it elsewhere. Could it be embedded, mocked, or hidden under a custom abstraction?Front-End Dependencies
Let’s do the same on the frontend side:
npm list --depth=0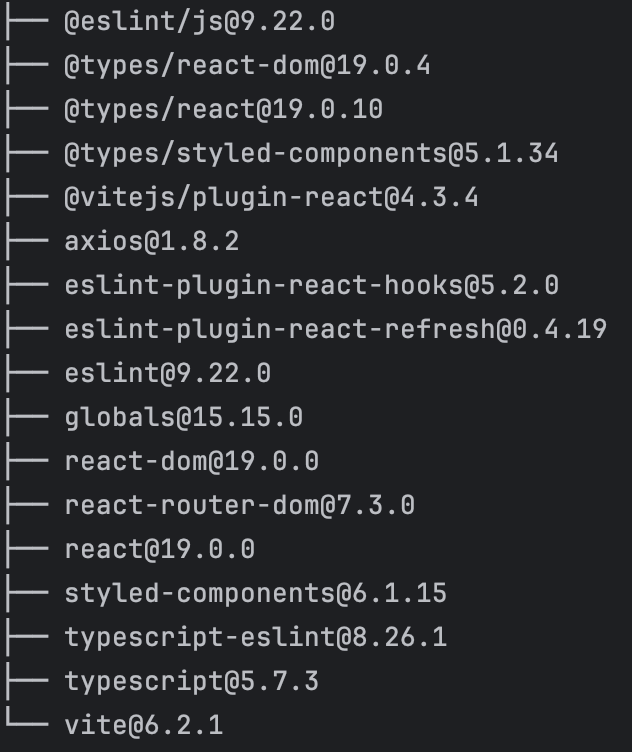
Findings:
- Nothing exotic or surprising.
axiosis likely used for making HTTP calls to the API.- Other dependencies suggest a modern JavaScript setup, likely with
React,vite,eslint, etc.
Assess Dependency Freshness
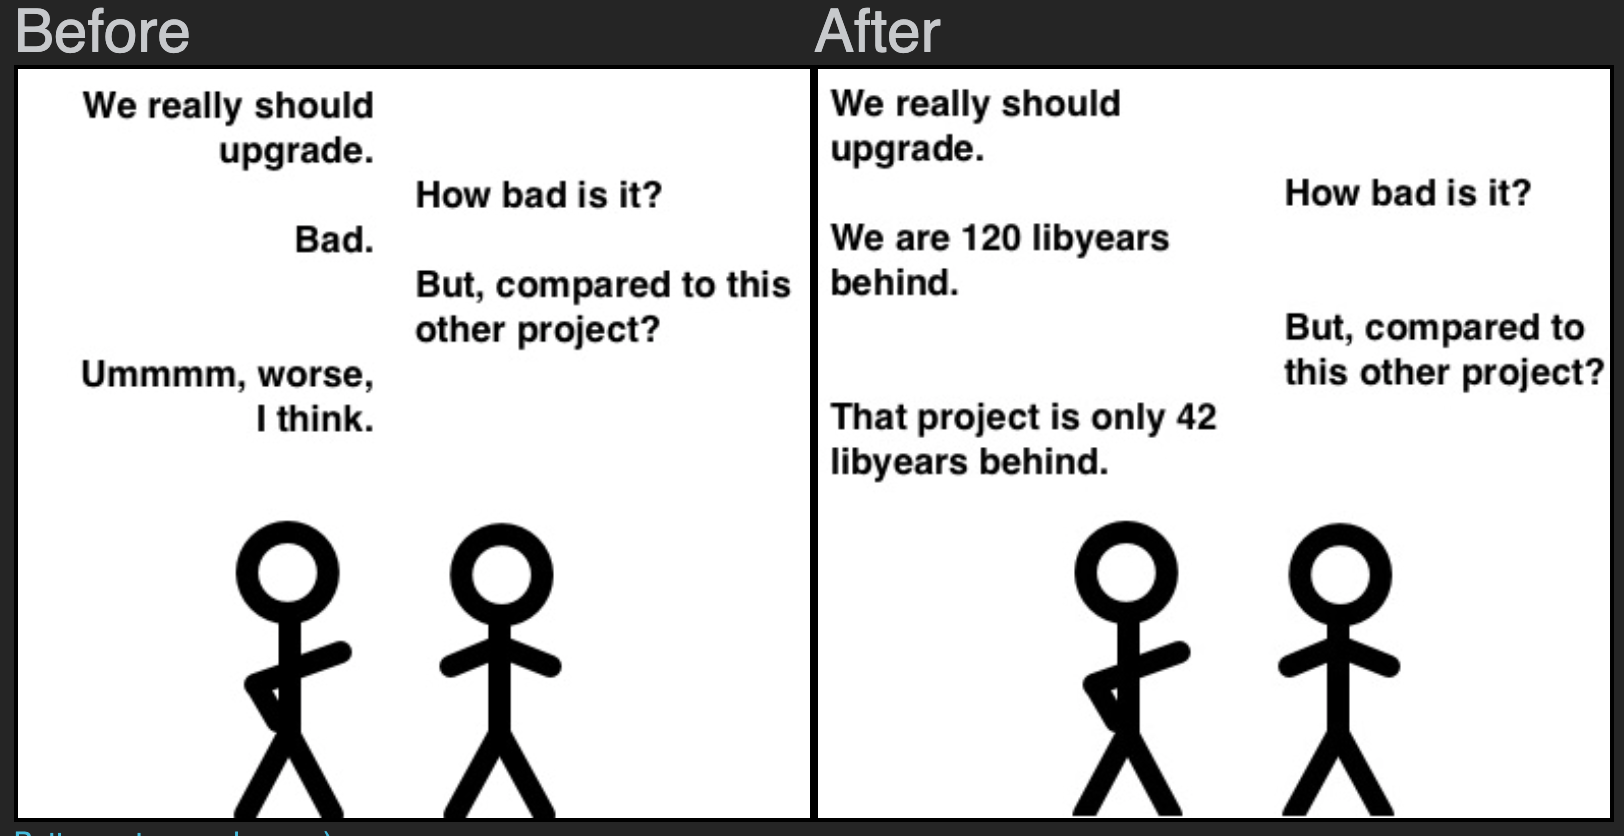
Dependencies tell us what a system relies on — but LibYear tells us how outdated those dependencies are.
What is LibYear?
It’s a metric that measures the age drift of your dependencies.
A package that’s one year behind its latest version contributes one libyear of drift.
The more libyears you accumulate, the more technical debt you’re carrying — and the riskier it becomes to update later.
You can read more here: Libyear
Running LibYear on the Back-End
dotnet tool install -g libyear
dotnet libyear
We are almost 42 libyears behind on the back-end part
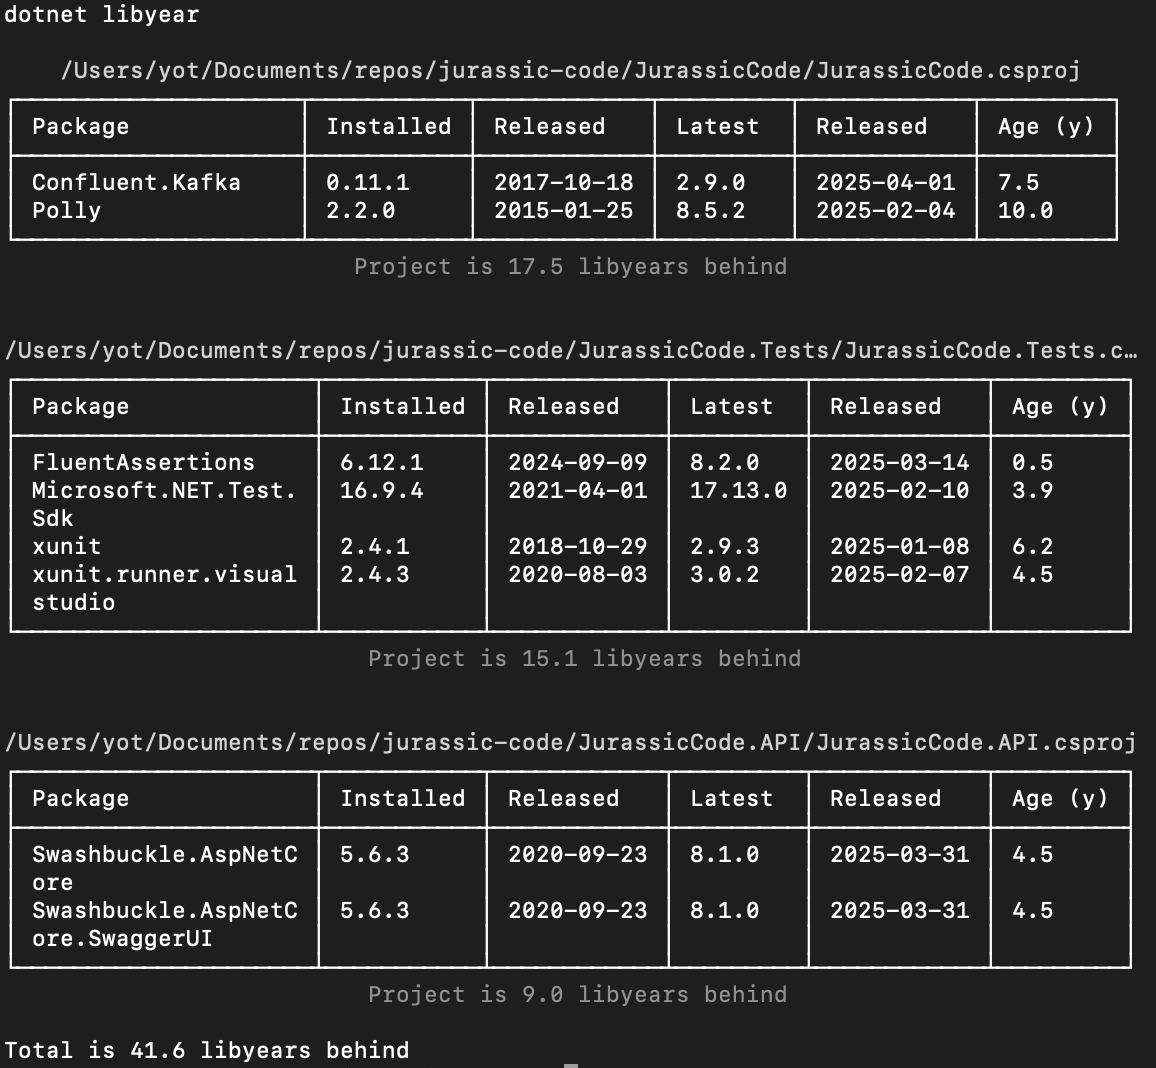
That’s a strong signal that:
- Dependencies haven't been updated in a while,
- We're potentially exposed to unpatched vulnerabilities or missing features,
- Any future update may become painful due to large version jumps.
Running LibYear on the Front-End
npx libyearSurprisingly, the front-end is in much better shape — with less than 1 libyear of drift!
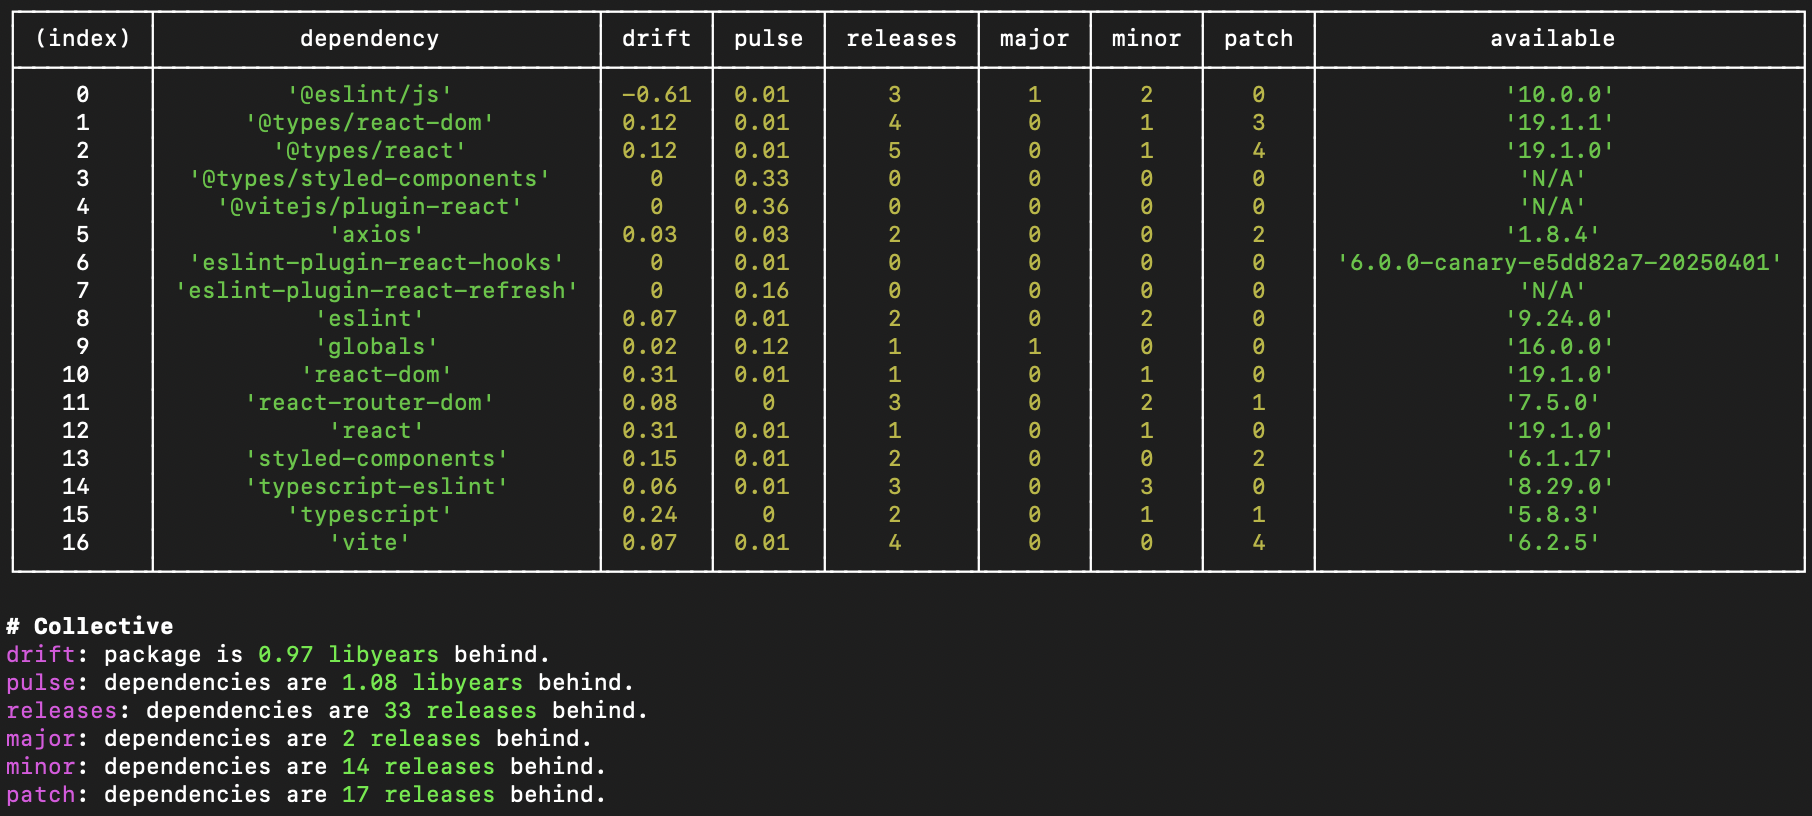
This suggests:
- The front-end is either newer or better maintained,
- Developers may be more used to frequent updates in the JS ecosystem...
Gather Metrics to Observe Code Quality
Once we’ve walked the surface and structure of the system, it’s time to gather quantitative signals.
Metrics give us a factual lens into the system’s quality and maintainability.
They reveal what our eyes may miss, and help us prioritize where to focus attention next.
Code Coverage
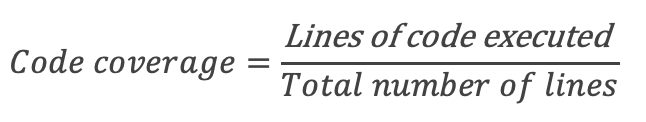
Code coverage shows how much of the source code is exercised by the test suite.
While 100% coverage doesn't guarantee quality, very low coverage is almost always a red flag.
dotnet tool install --global JetBrains.dotCover.GlobalTool
dotnet dotcover test --dcReportType=HTML JurassicCode.sln
Here's what we get on the back-end:
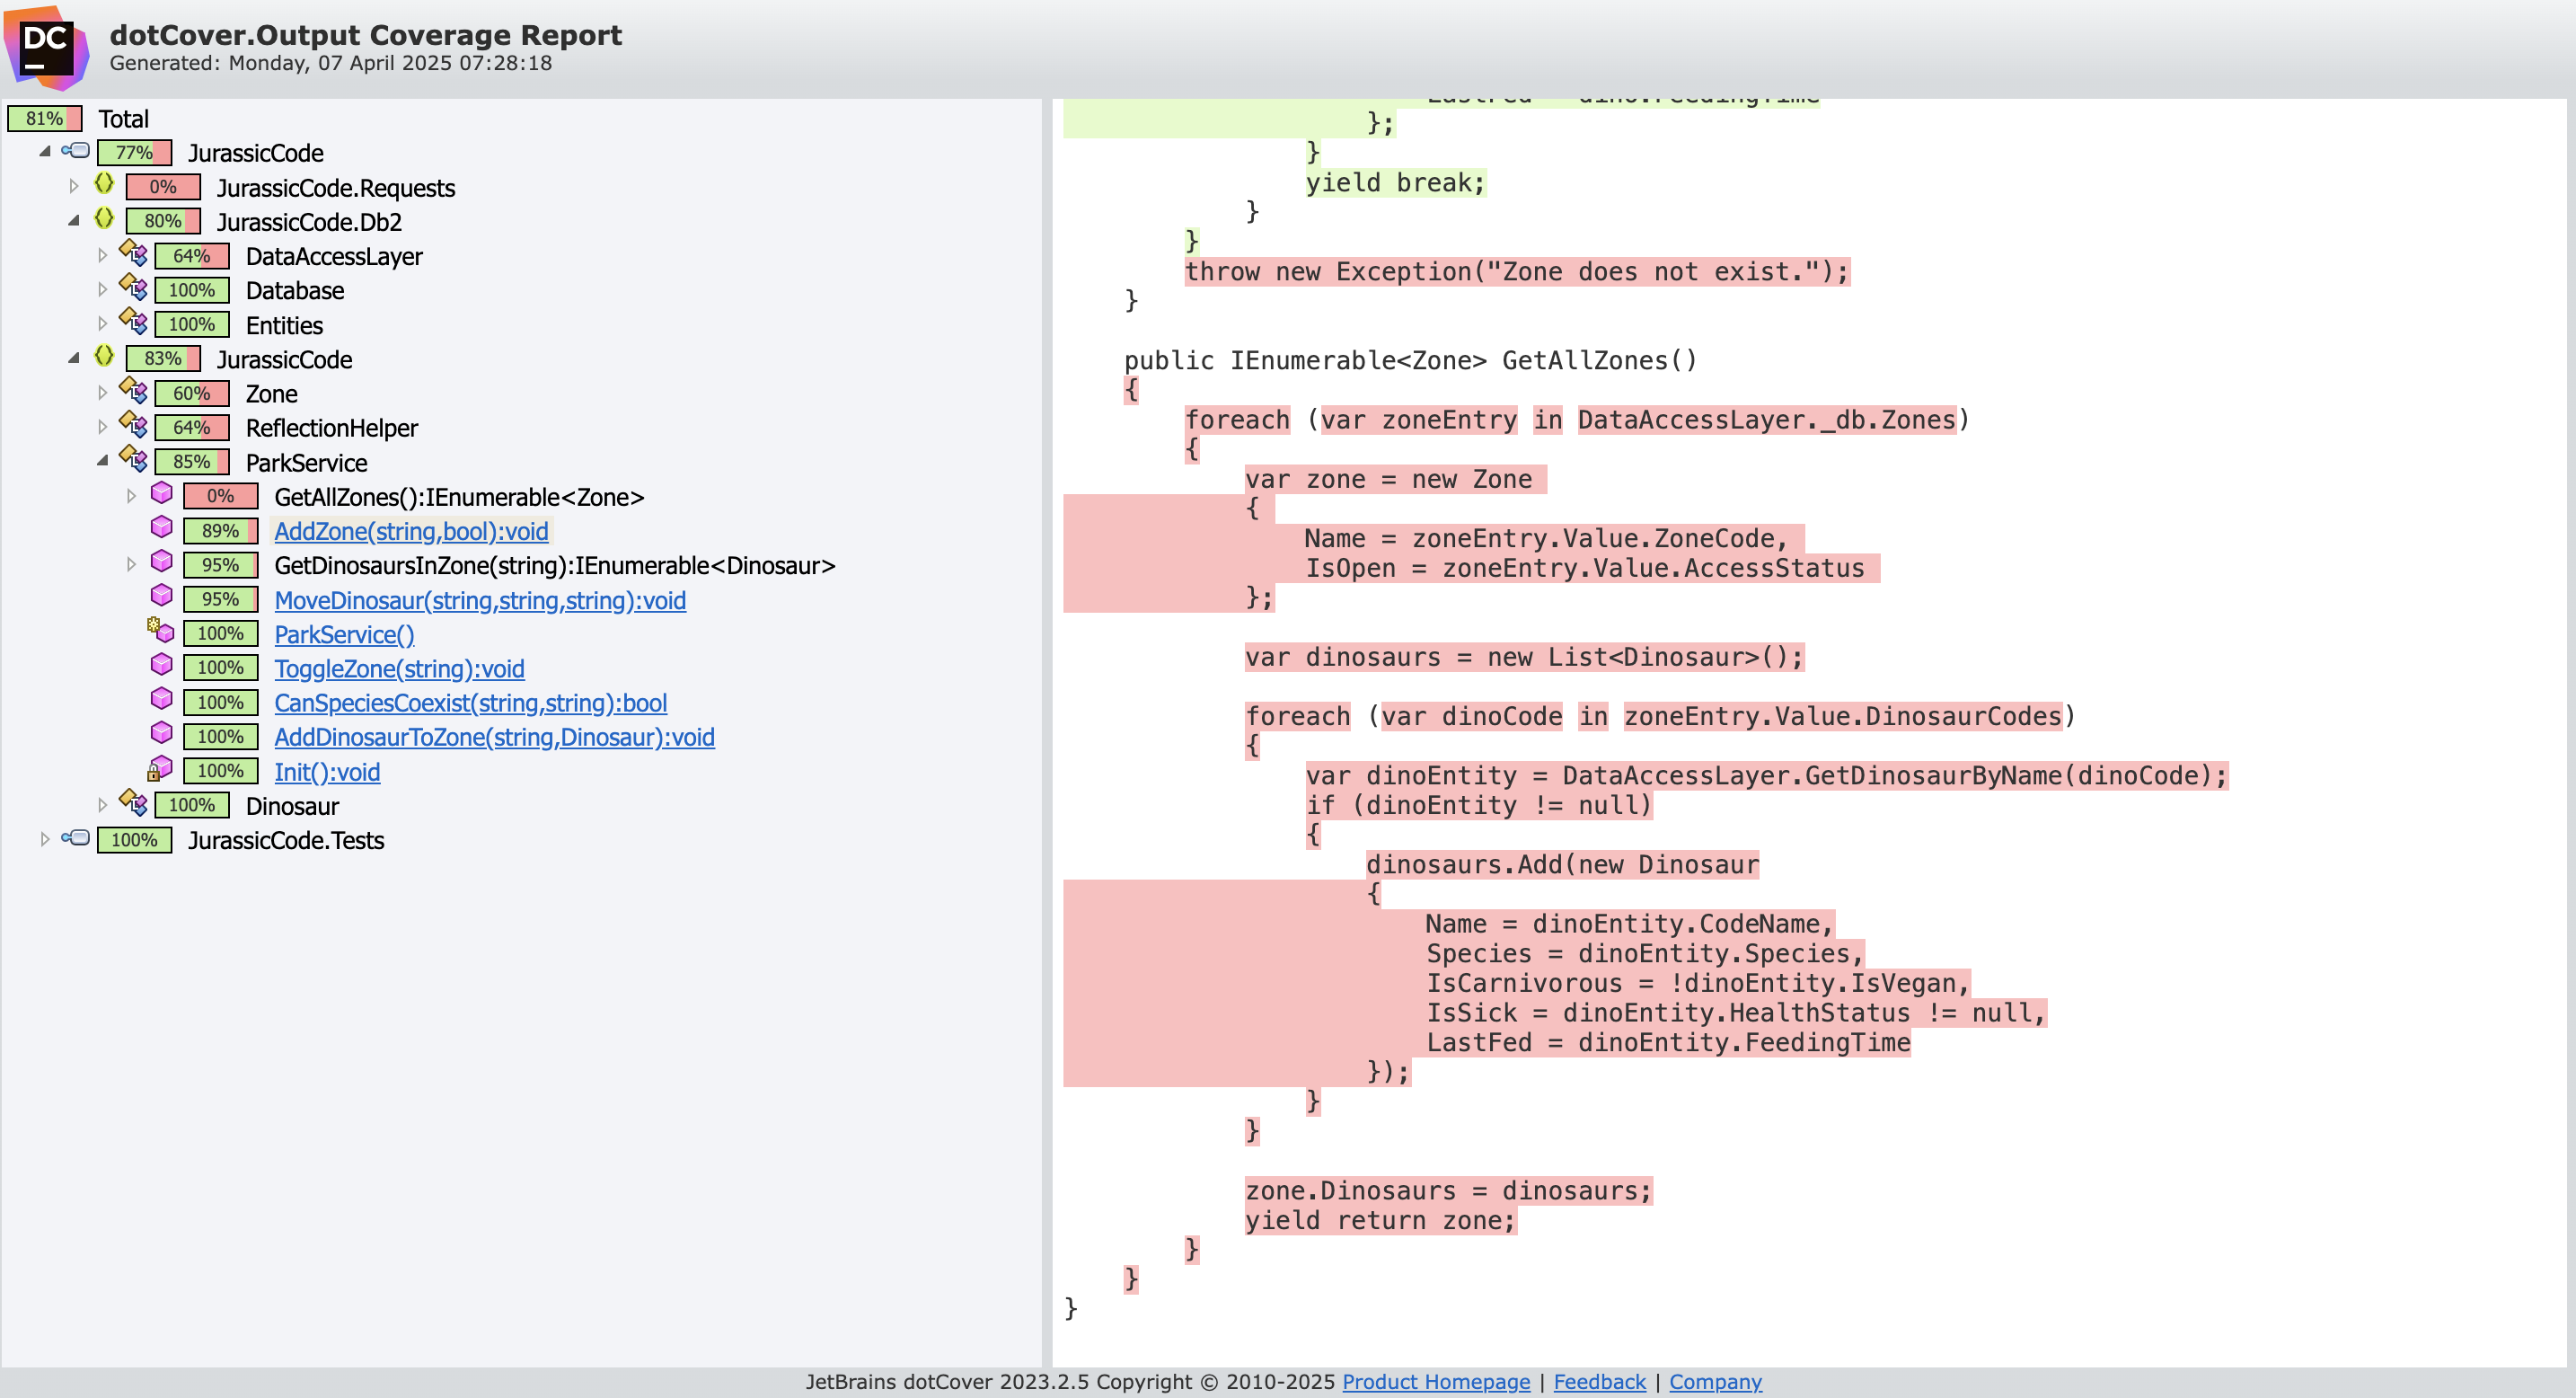
The back-end shows a solid 81% line coverage — that’s a healthy signal!
On the front-end, however:
0% coverage — no tests detected.
Test Quality
Let’s dig deeper into test readability and maintainability.
Here's an example of a back-end test:
[Fact]
// Bad naming: what is the intent here?
// Too many reasons to fail here... making it hard to understand / maintain
public void TestAddAndMoveDinosaursWithZoneToggle()
{
    // Arrange: a lot of Arrange
    // What is relevant in this setup for the outcome of our test?
    DataAccessLayer.Init(new Database());
    // Not clear what is setup with this boolean
    // Hardcoded values
    _parkService.AddZone("Test Zone 1", true);
    _parkService.AddZone("Test Zone 2", false);

    _parkService.AddDinosaurToZone("Test Zone 1", new Dinosaur { Name = "TestDino1", Species = "T-Rex", IsCarnivorous = true });
    _parkService.AddDinosaurToZone("Test Zone 1", new Dinosaur { Name = "TestDino2", Species = "Velociraptor", IsCarnivorous = true });

    // Act
    Action moveToClosedZone = () => _parkService.MoveDinosaur("Test Zone 1", "Test Zone 3", "TestDino1");
    // Assert
    moveToClosedZone.Should().Throw<Exception>().WithMessage("Zones are closed or do not exist.");

    // Arrange
    _parkService.ToggleZone("Test Zone 2");
    // Act
    _parkService.MoveDinosaur("Test Zone 1", "Test Zone 2", "TestDino1");

    // Assert
    var zone2Dinosaurs = _parkService.GetDinosaursInZone("Test Zone 2");
    zone2Dinosaurs.Should().Contain(d => d.Name == "TestDino1");
    var zone1Dinosaurs = _parkService.GetDinosaursInZone("Test Zone 1");
    zone1Dinosaurs.Should().NotContain(d => d.Name == "TestDino1");

    // Assert another behavior
    bool canCoexist = _parkService.CanSpeciesCoexist("T-Rex", "Velociraptor");
    canCoexist.Should().BeFalse();
    canCoexist = _parkService.CanSpeciesCoexist("Triceratops", "Velociraptor");
    canCoexist.Should().BeTrue();

    // Assert another behavior
    _parkService.ToggleZone("Test Zone 1");
    Action addToClosedZone = () => _parkService.AddDinosaurToZone("Test Zone 1", new Dinosaur { Name = "TestDino3", Species = "Triceratops", IsCarnivorous = false });
    addToClosedZone.Should().Throw<Exception>().WithMessage("Zone is closed or does not exist.");
}
This test:Has a vague name,Tries to cover too many things at once (multiple asserts, flows),Has unclear setups and hardcoded values.Has too many reasons to fail, making it hard to trust or maintain.
These signs suggest that while the test suite exists, it may be brittle, hard to evolve, and difficult to debug.
Mutation Testing
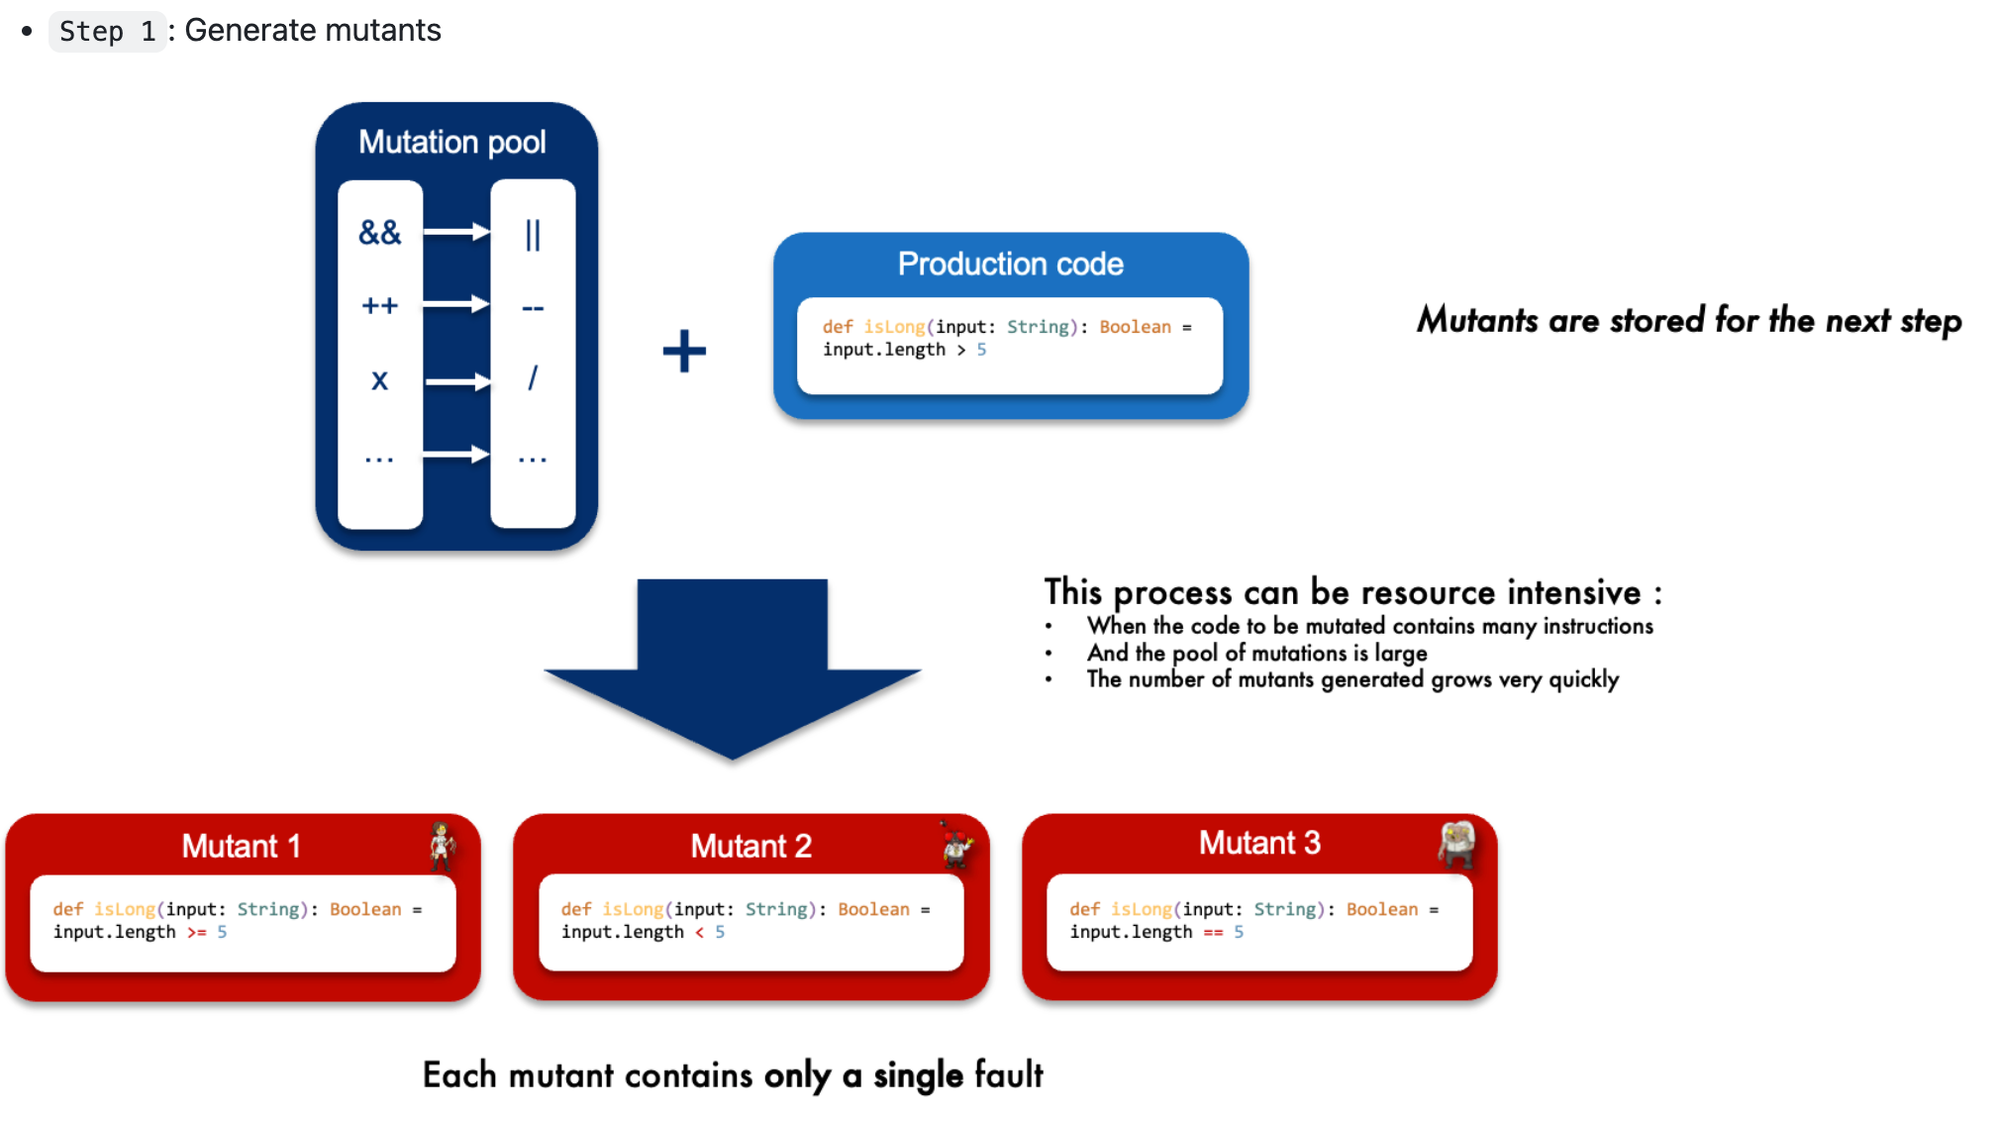
To push test quality even further, we run mutation testing — a technique where we intentionally introduce bugs (mutants) into the code to see if the test suite catches them.
dotnet stryker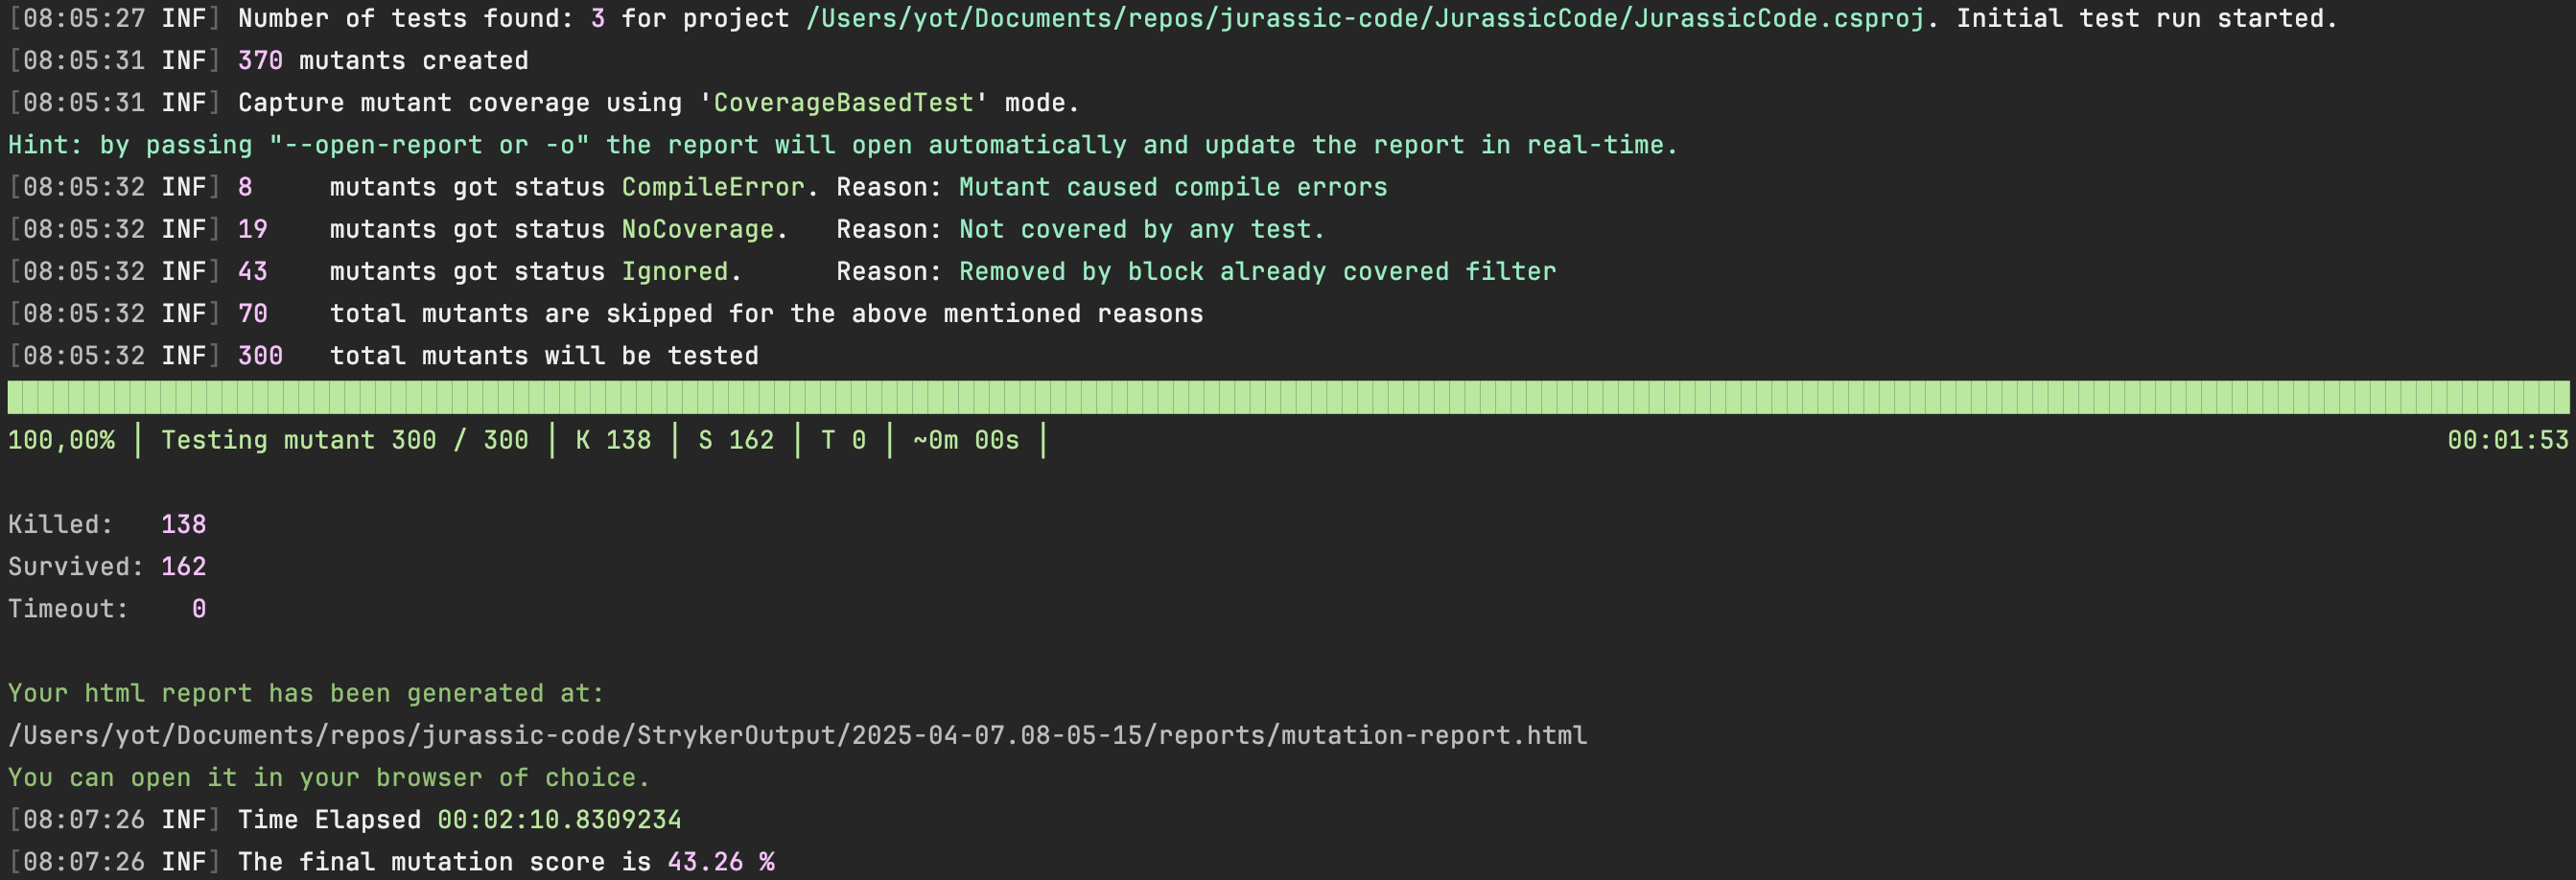
Mutation score at 43.26%

What this means:
- 43% of injected faults were caught (mutants "killed"),
- But 57% survived, meaning the tests didn’t detect the problem.
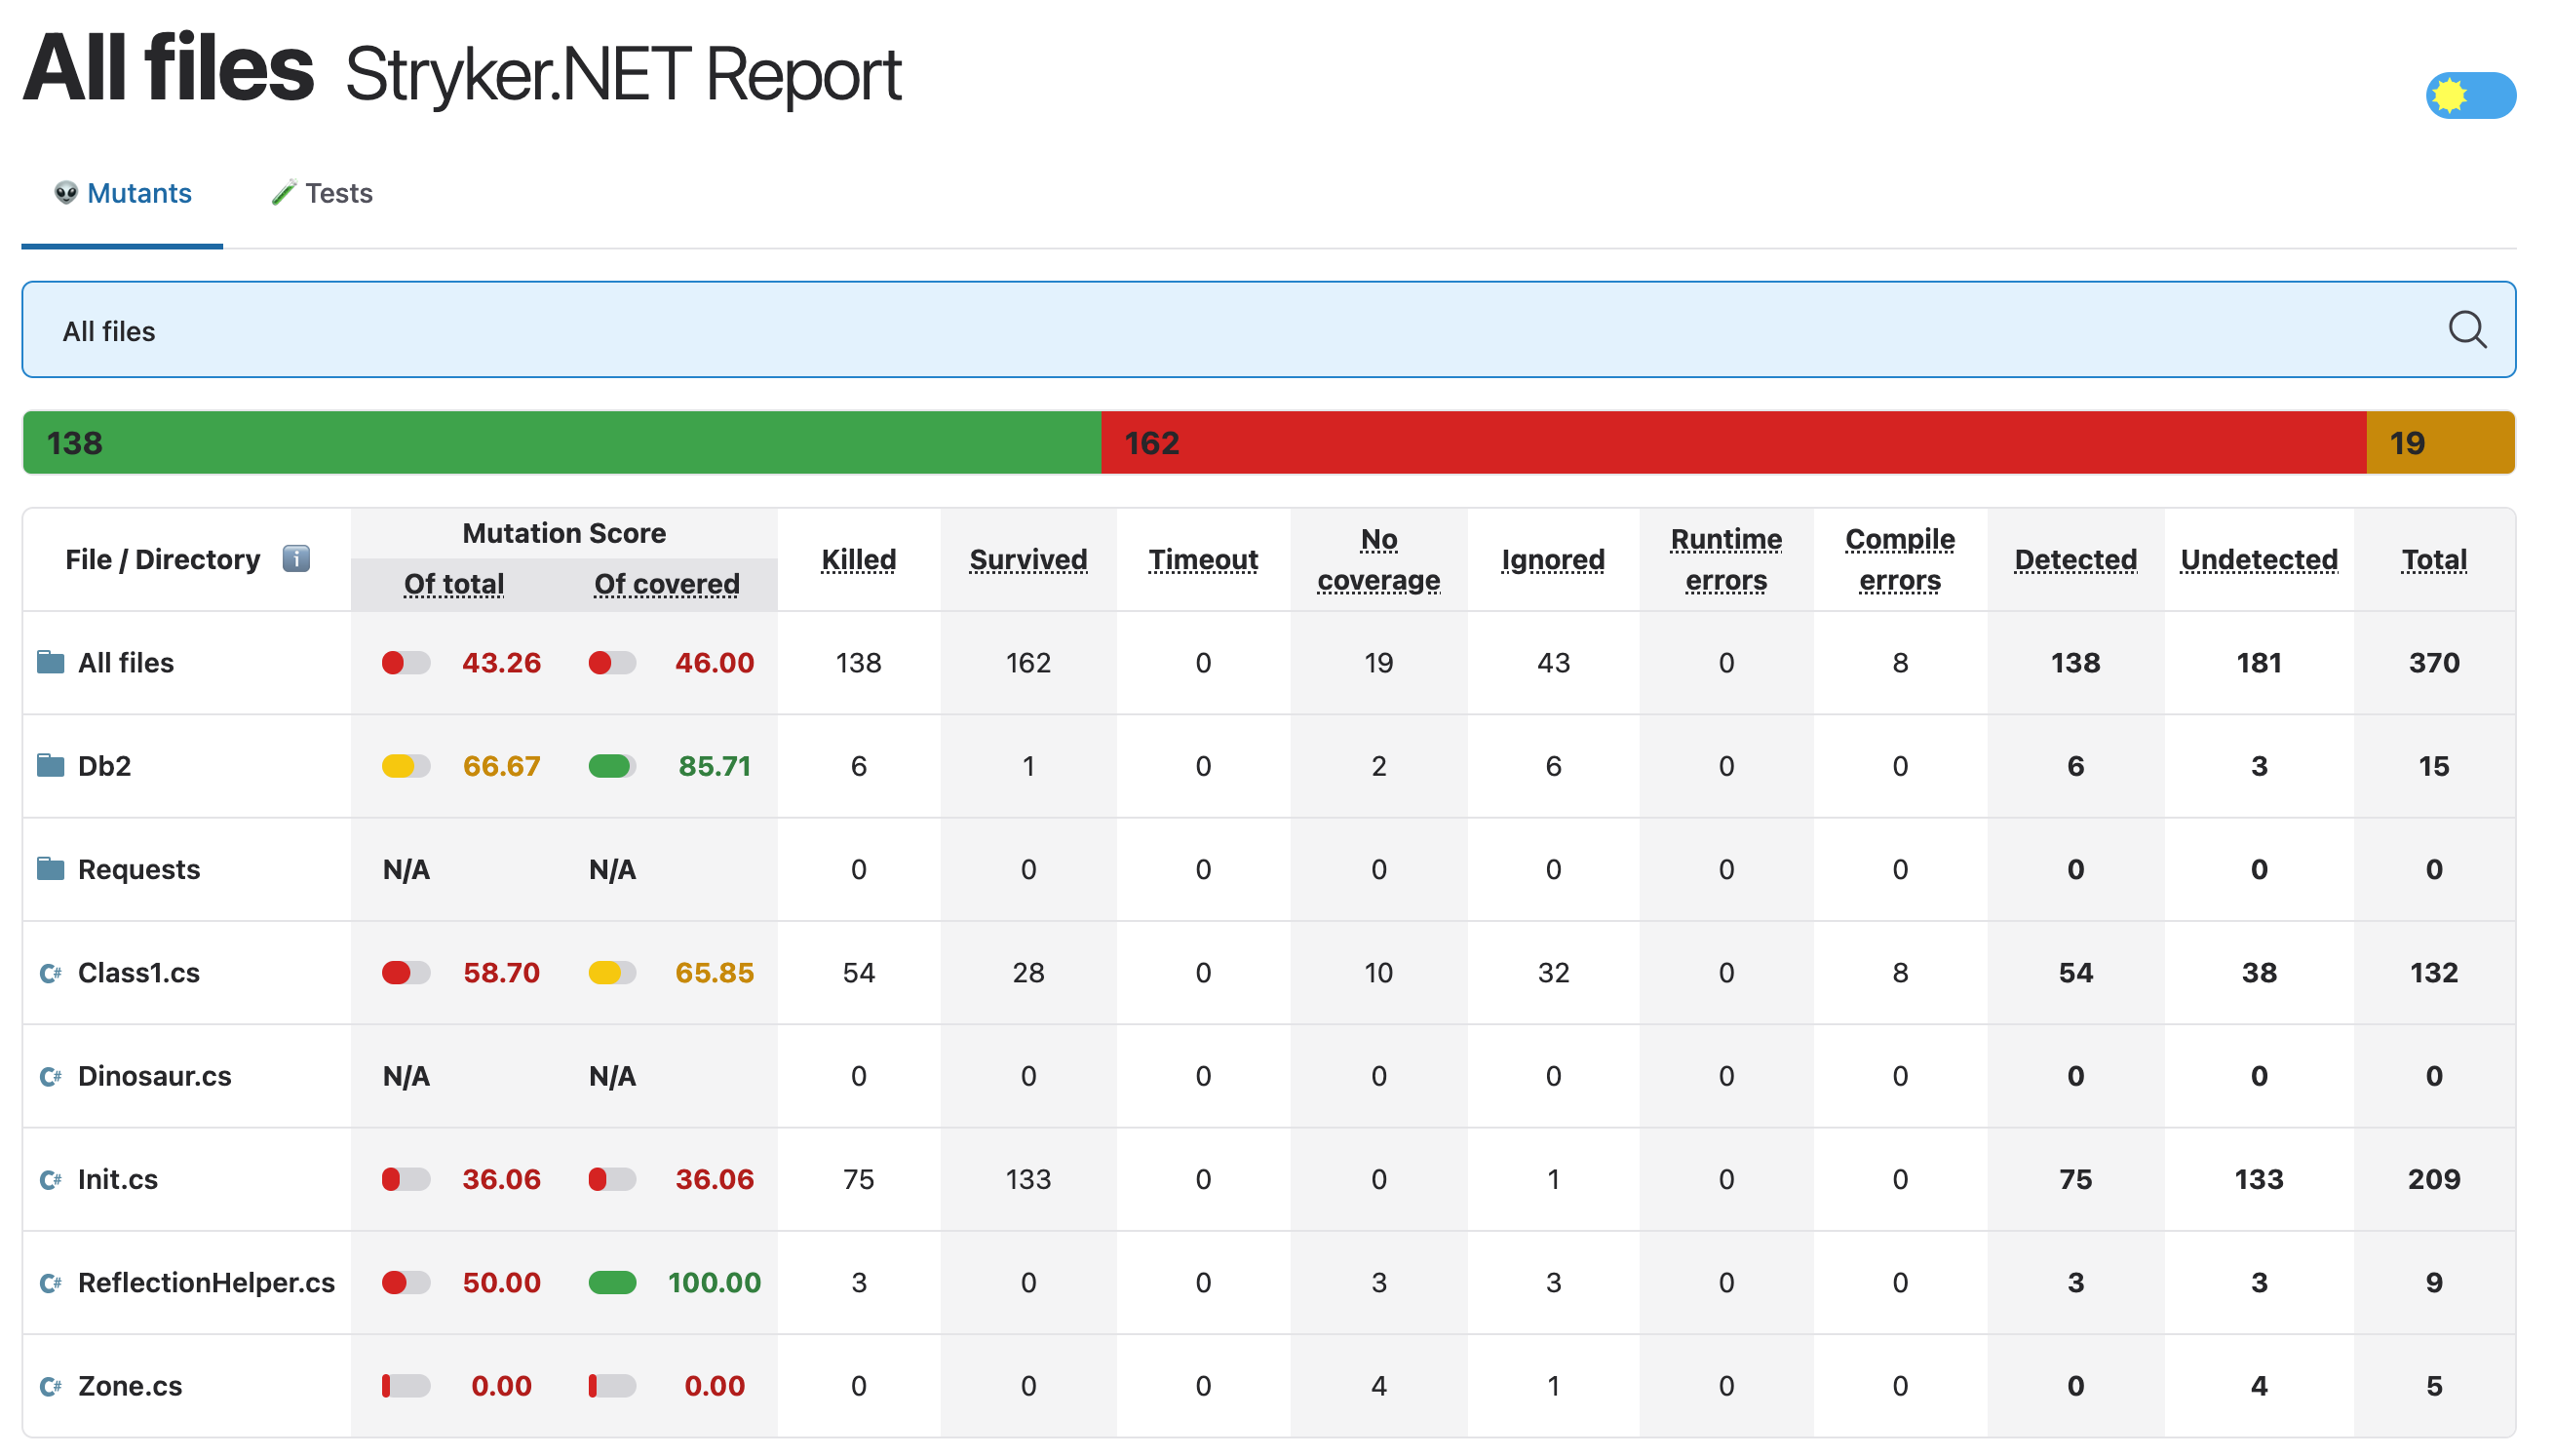
Killed: At least one test failed while this mutant was active.- The mutant is killed. This is what you want, good job!
Survived: When all tests passed while this mutant was active, the mutant survivedTimeout: The running of tests with this mutant active resulted in a timeout.- For example, the mutant resulted in an infinite loop in your code.
No coverage: The mutant isn't covered by one of your tests and survived as a result.Ignored: The mutant wasn't tested because it is ignored.- Not count against your mutation score but will show up in reports.
You can explore this report here.
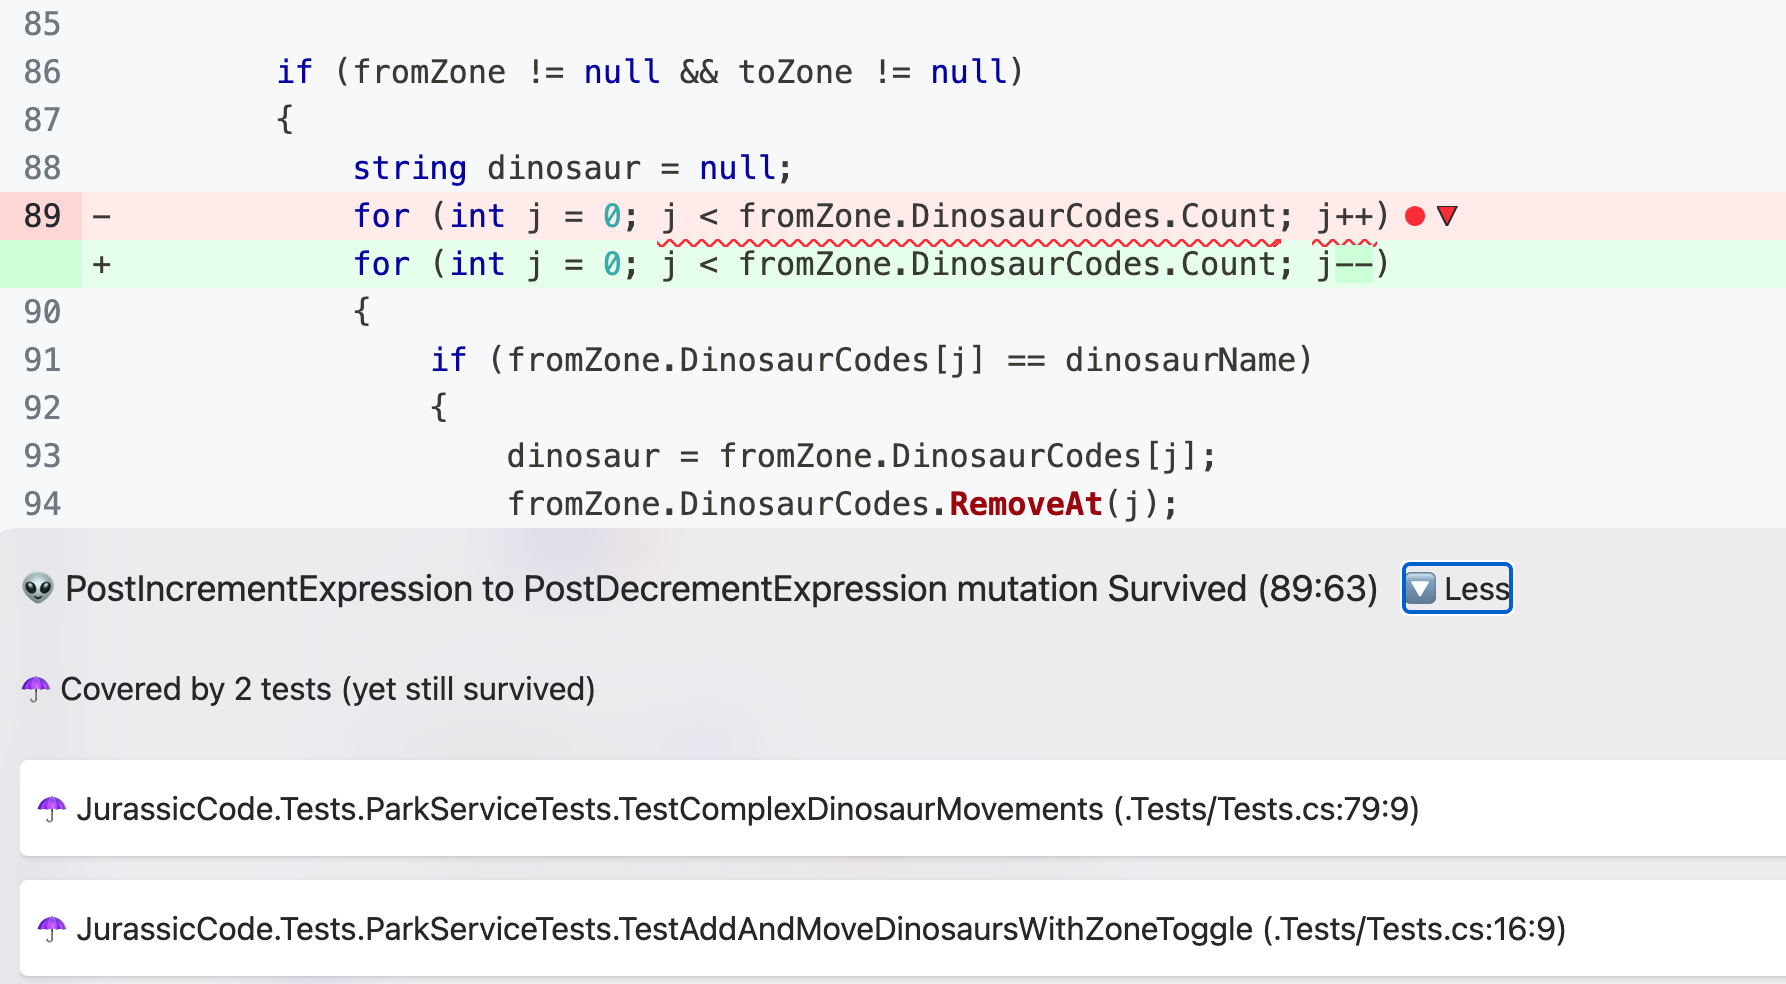
Coverage tells you where the tests are. Mutation testing tells you whether they’re doing their job.
More on mutation testing: Mutation Testing technique explained
Static Code Analysis
We also use SonarCloud to gather metrics on: Bugs, Code Smells, Cyclomatic Complexity, Security Hotspots, Duplication, ...
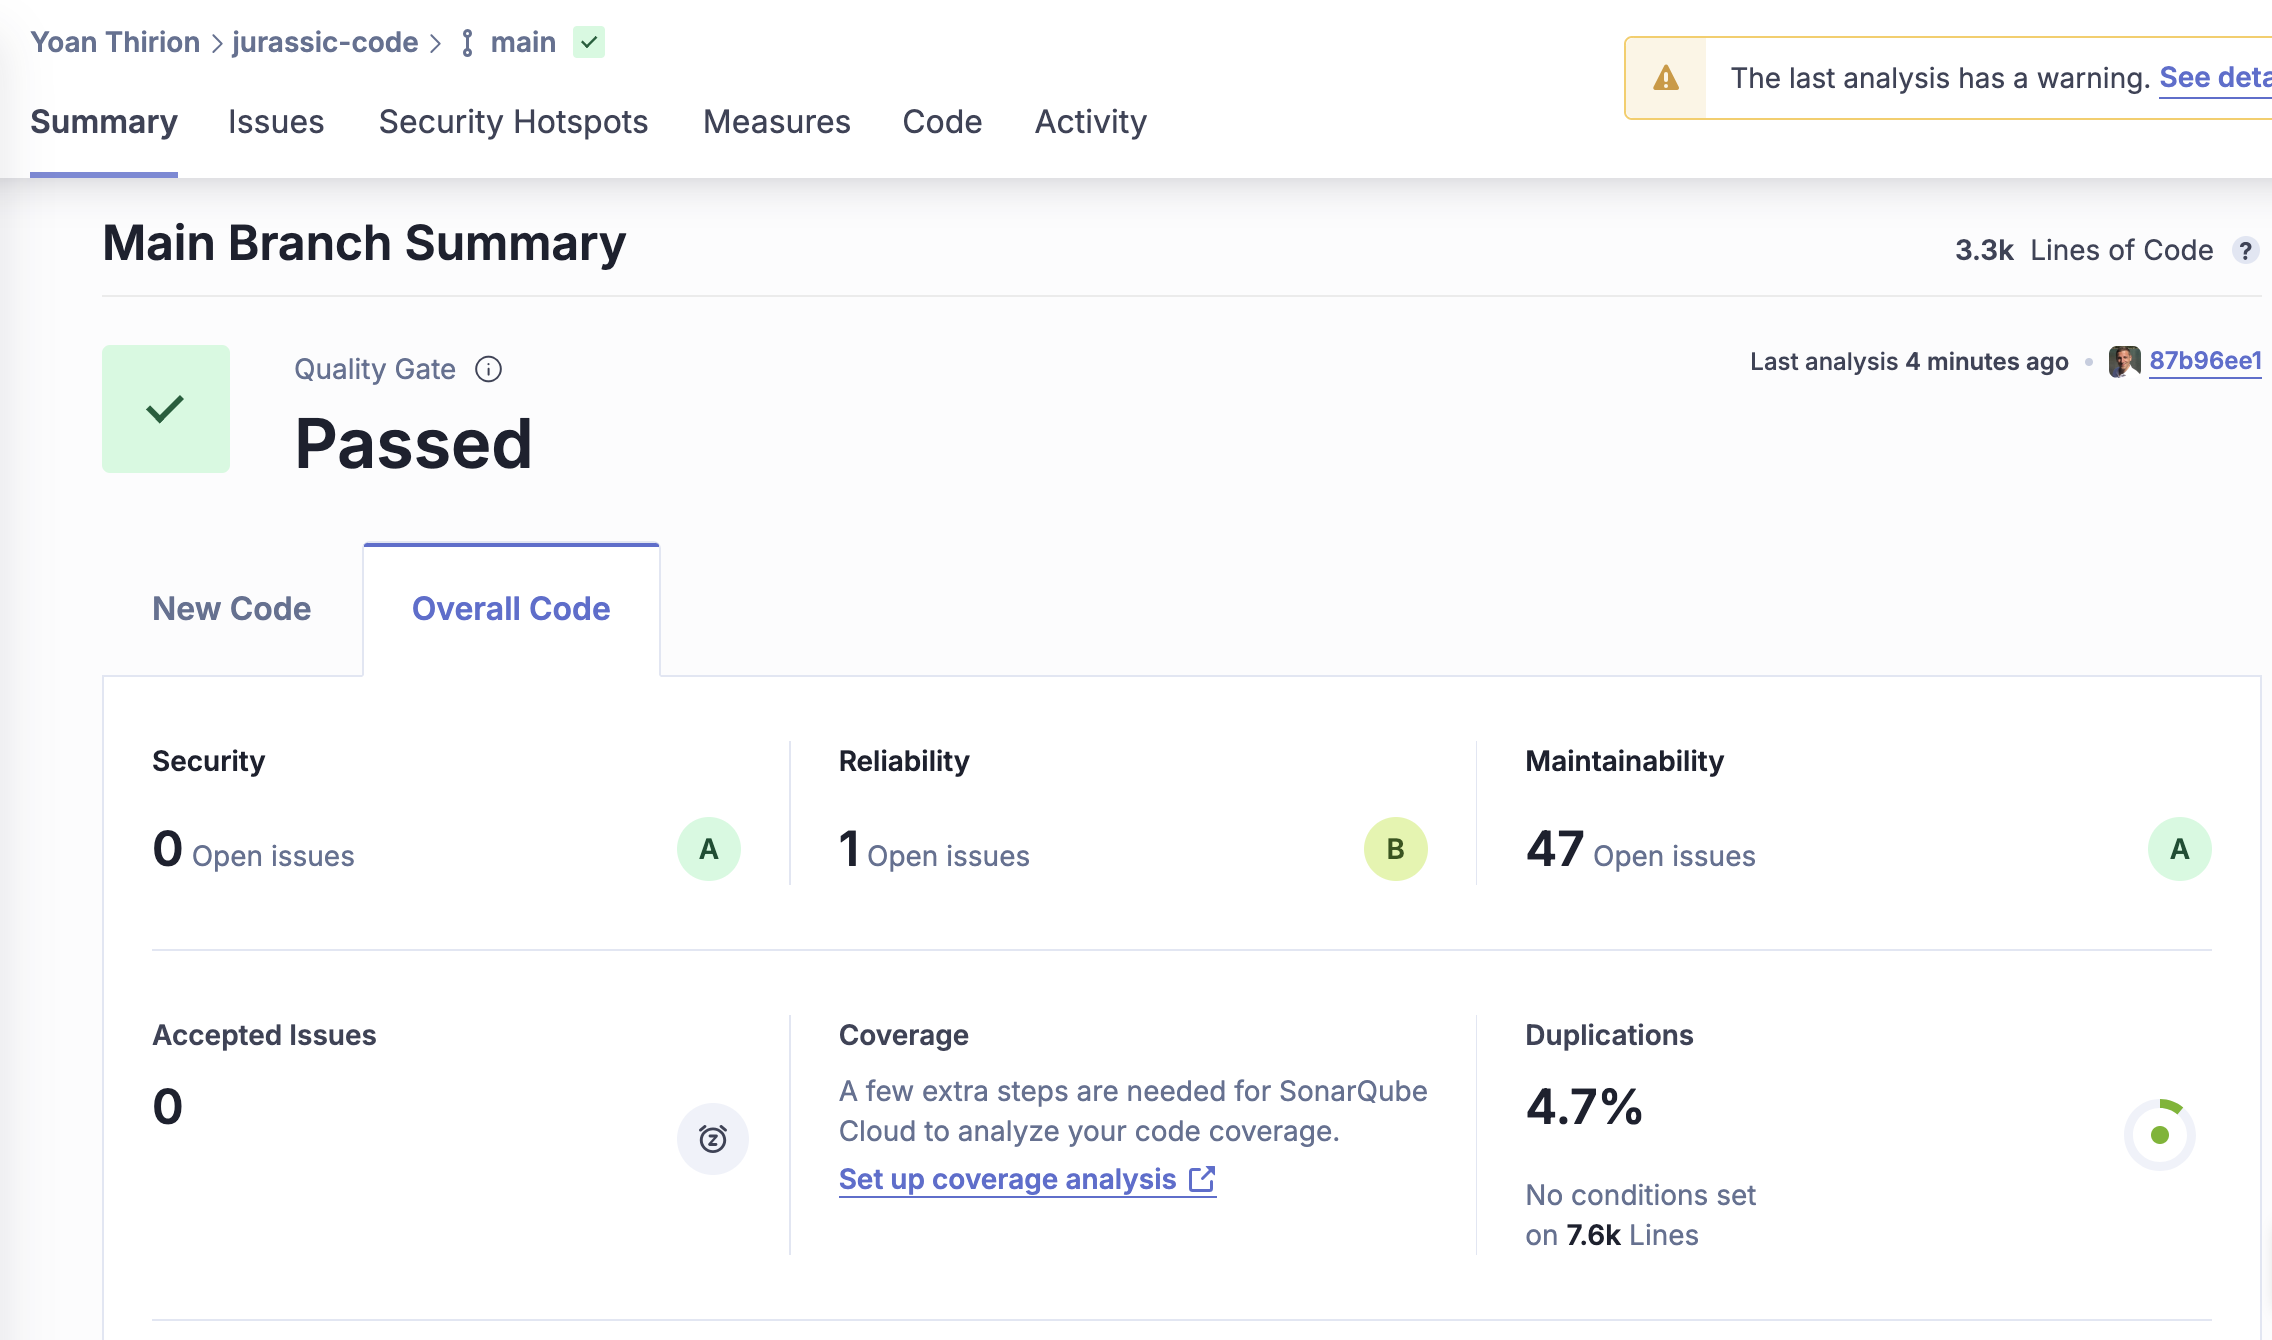
Key insights:
- 3300 lines of code (2390 in the UI),
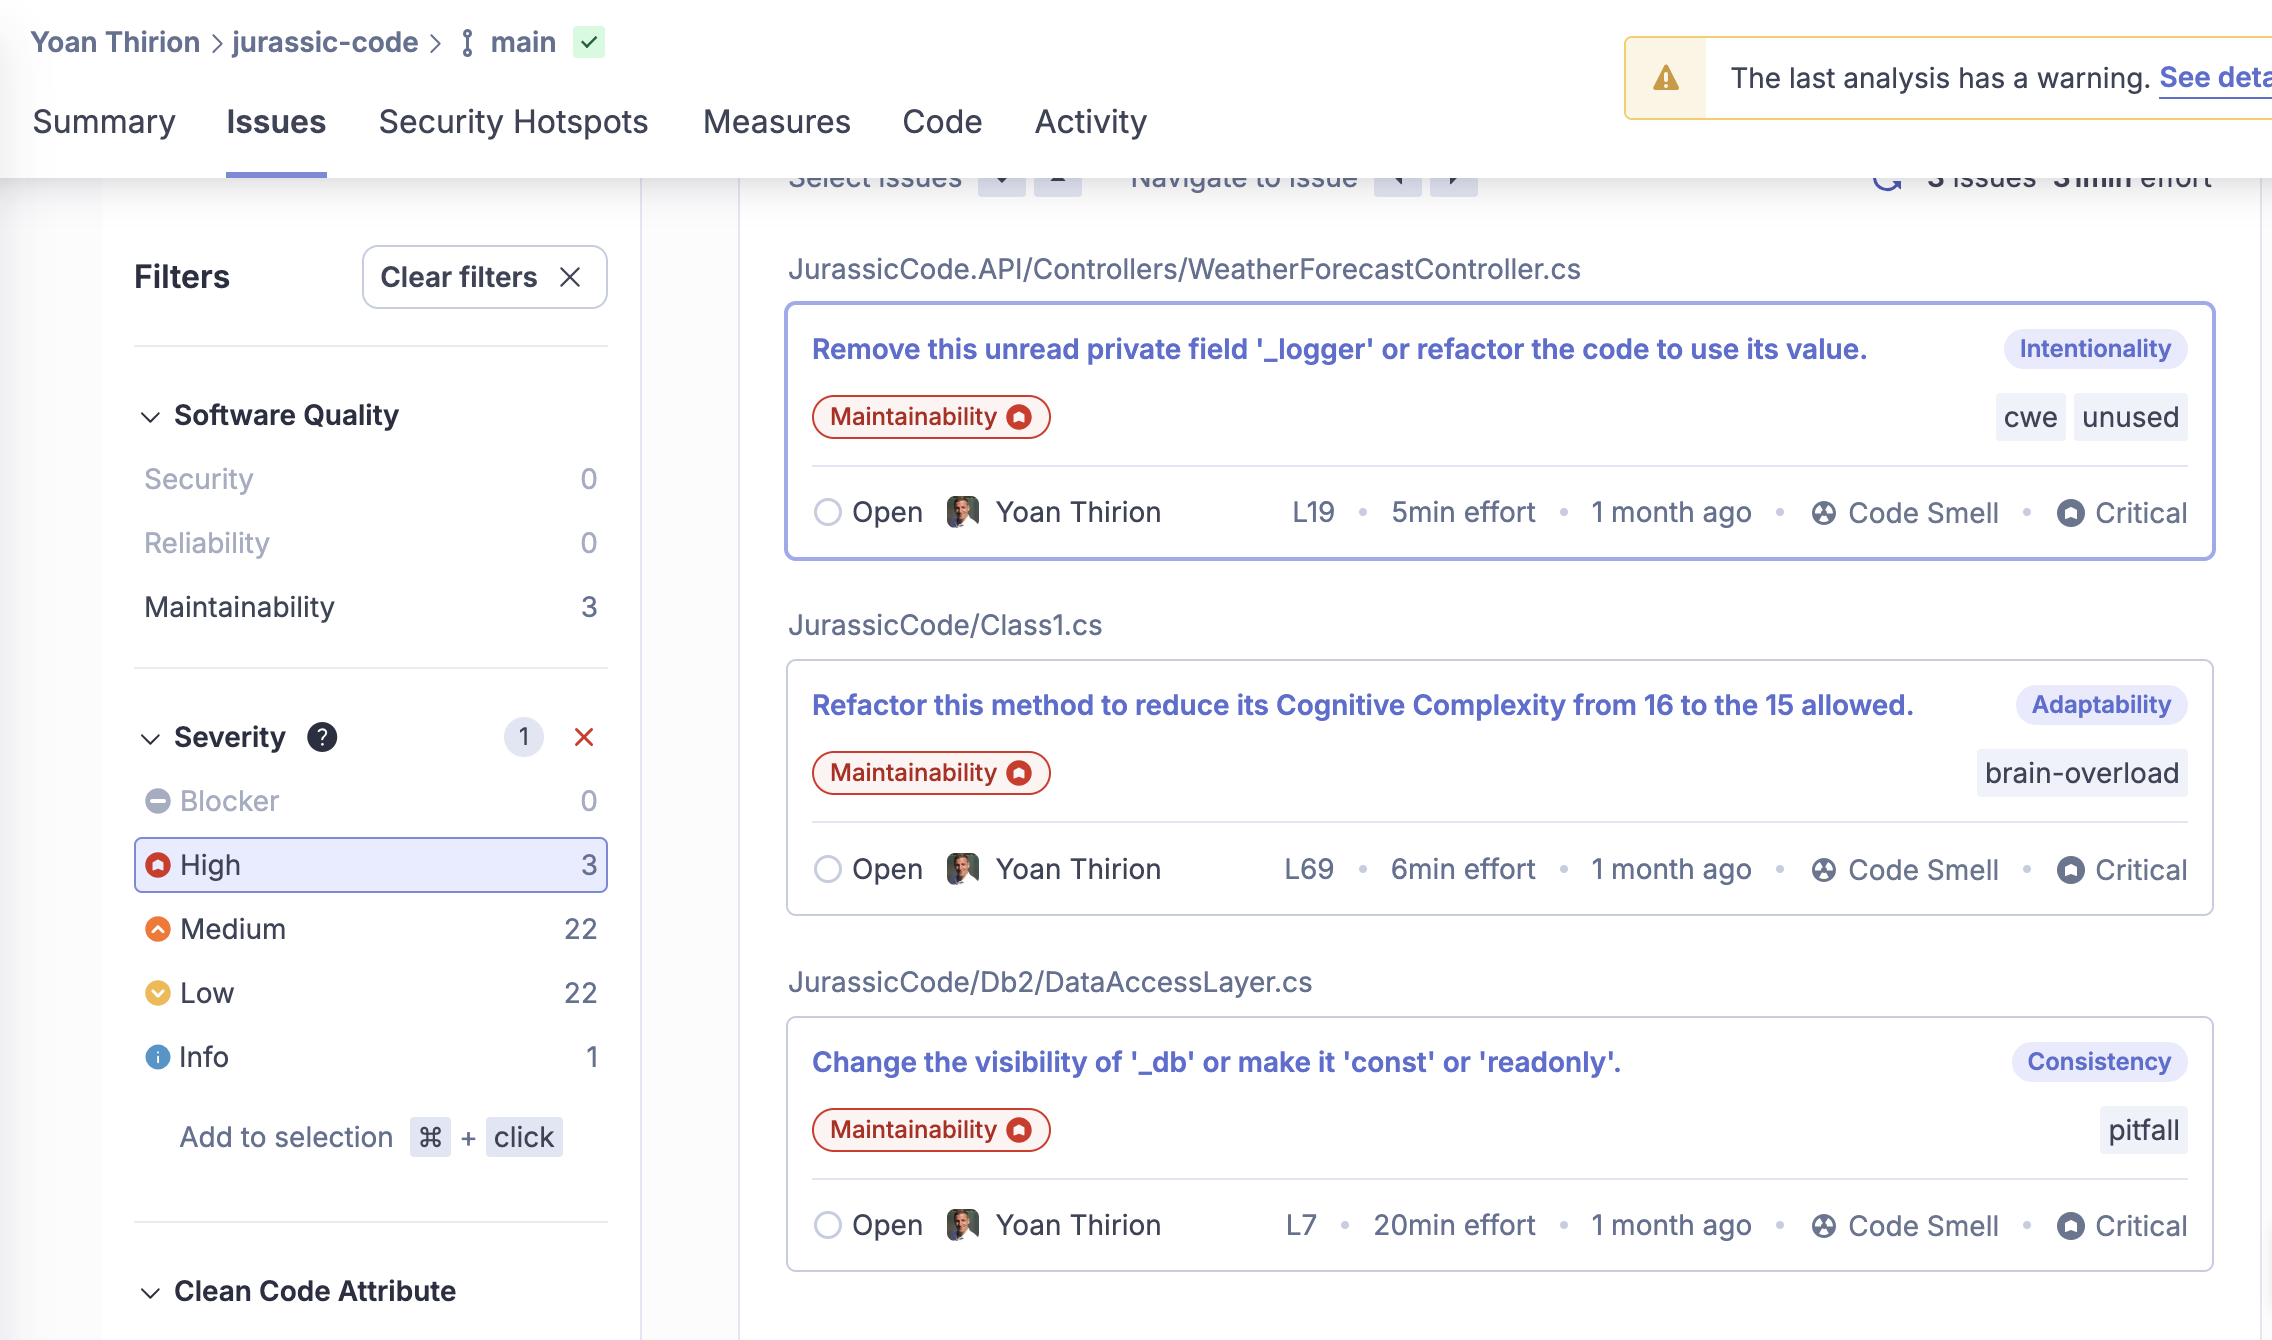
41.7%duplication in the back-end — quite high,- 4 Security Hotspots and 3 high-priority issues,
- Examples: poor encapsulation, cognitive complexity, and unused fields.
Branking forReliabilityregarding this usage:
// No encaspulation
// Dictionary can be mutated from the outside world
public readonly Dictionary<string, Entities.ZoneEntity> Zones = new Dictionary<string, Entities.ZoneEntity>();
Identify Hotspots with Behavioral Code Analysis
Even with static metrics and test coverage, you might still ask:
Where should I actually start refactoring?
That’s where behavioral code analysis comes in.
It’s not just about how the code looks — it’s about how the code is changed over time.
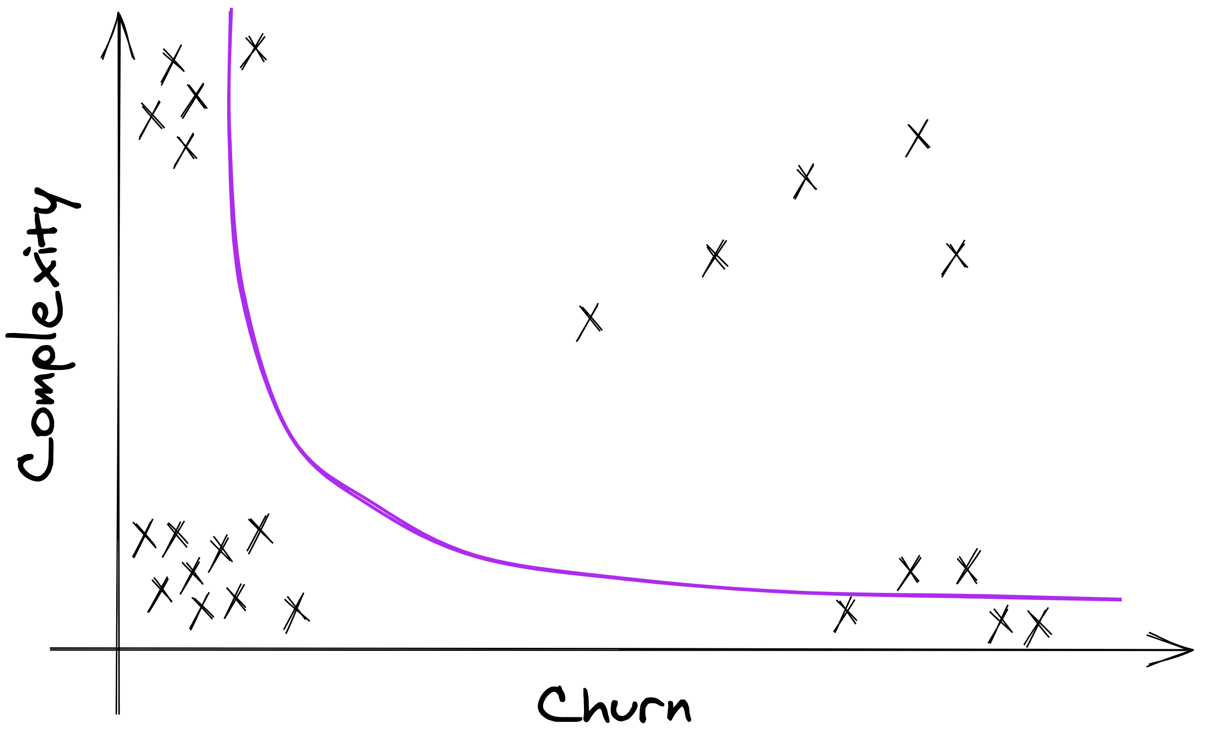
This approach combines code complexity with change frequency (a.k.a. “churn”) to identify hotspots — the files that are both complex and frequently modified.
These are the riskiest parts of the system, and the ones most worth your attention.
What is a Hotspot?
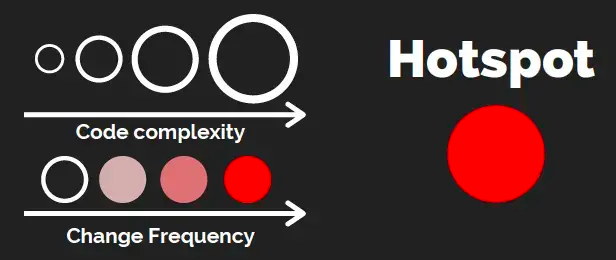
A Hotspot = High Complexity × High Change Frequency
You’ll often find:
- Big classes everyone avoids,
- Legacy modules under constant patching,
- Bug-prone areas no one dares to touch.
CodeScene
We use CodeScene by Adam Tornhill to run a behavioral analysis on the codebase.
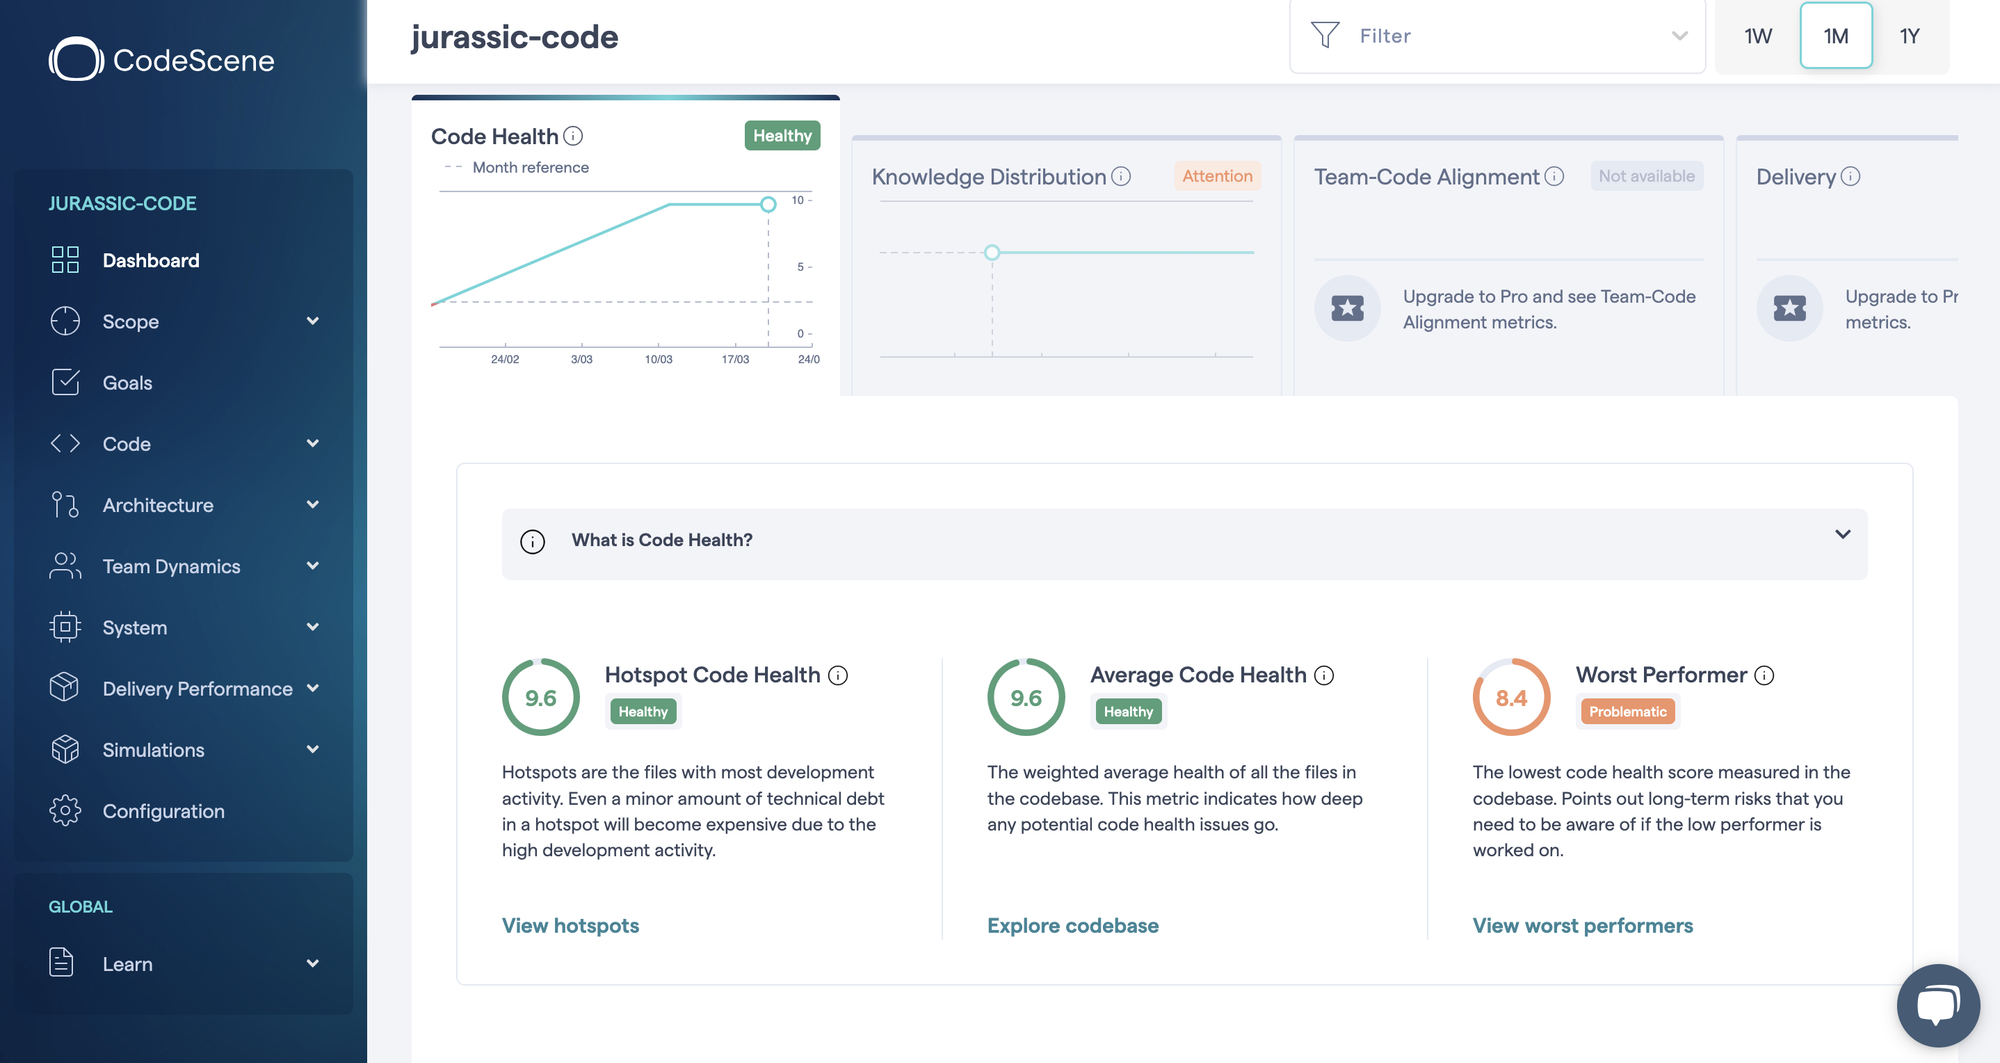
Code Health score is high overall: 9.6 / 10 — that's a very good baseline.
You can explore this report here.
Hotspot Results
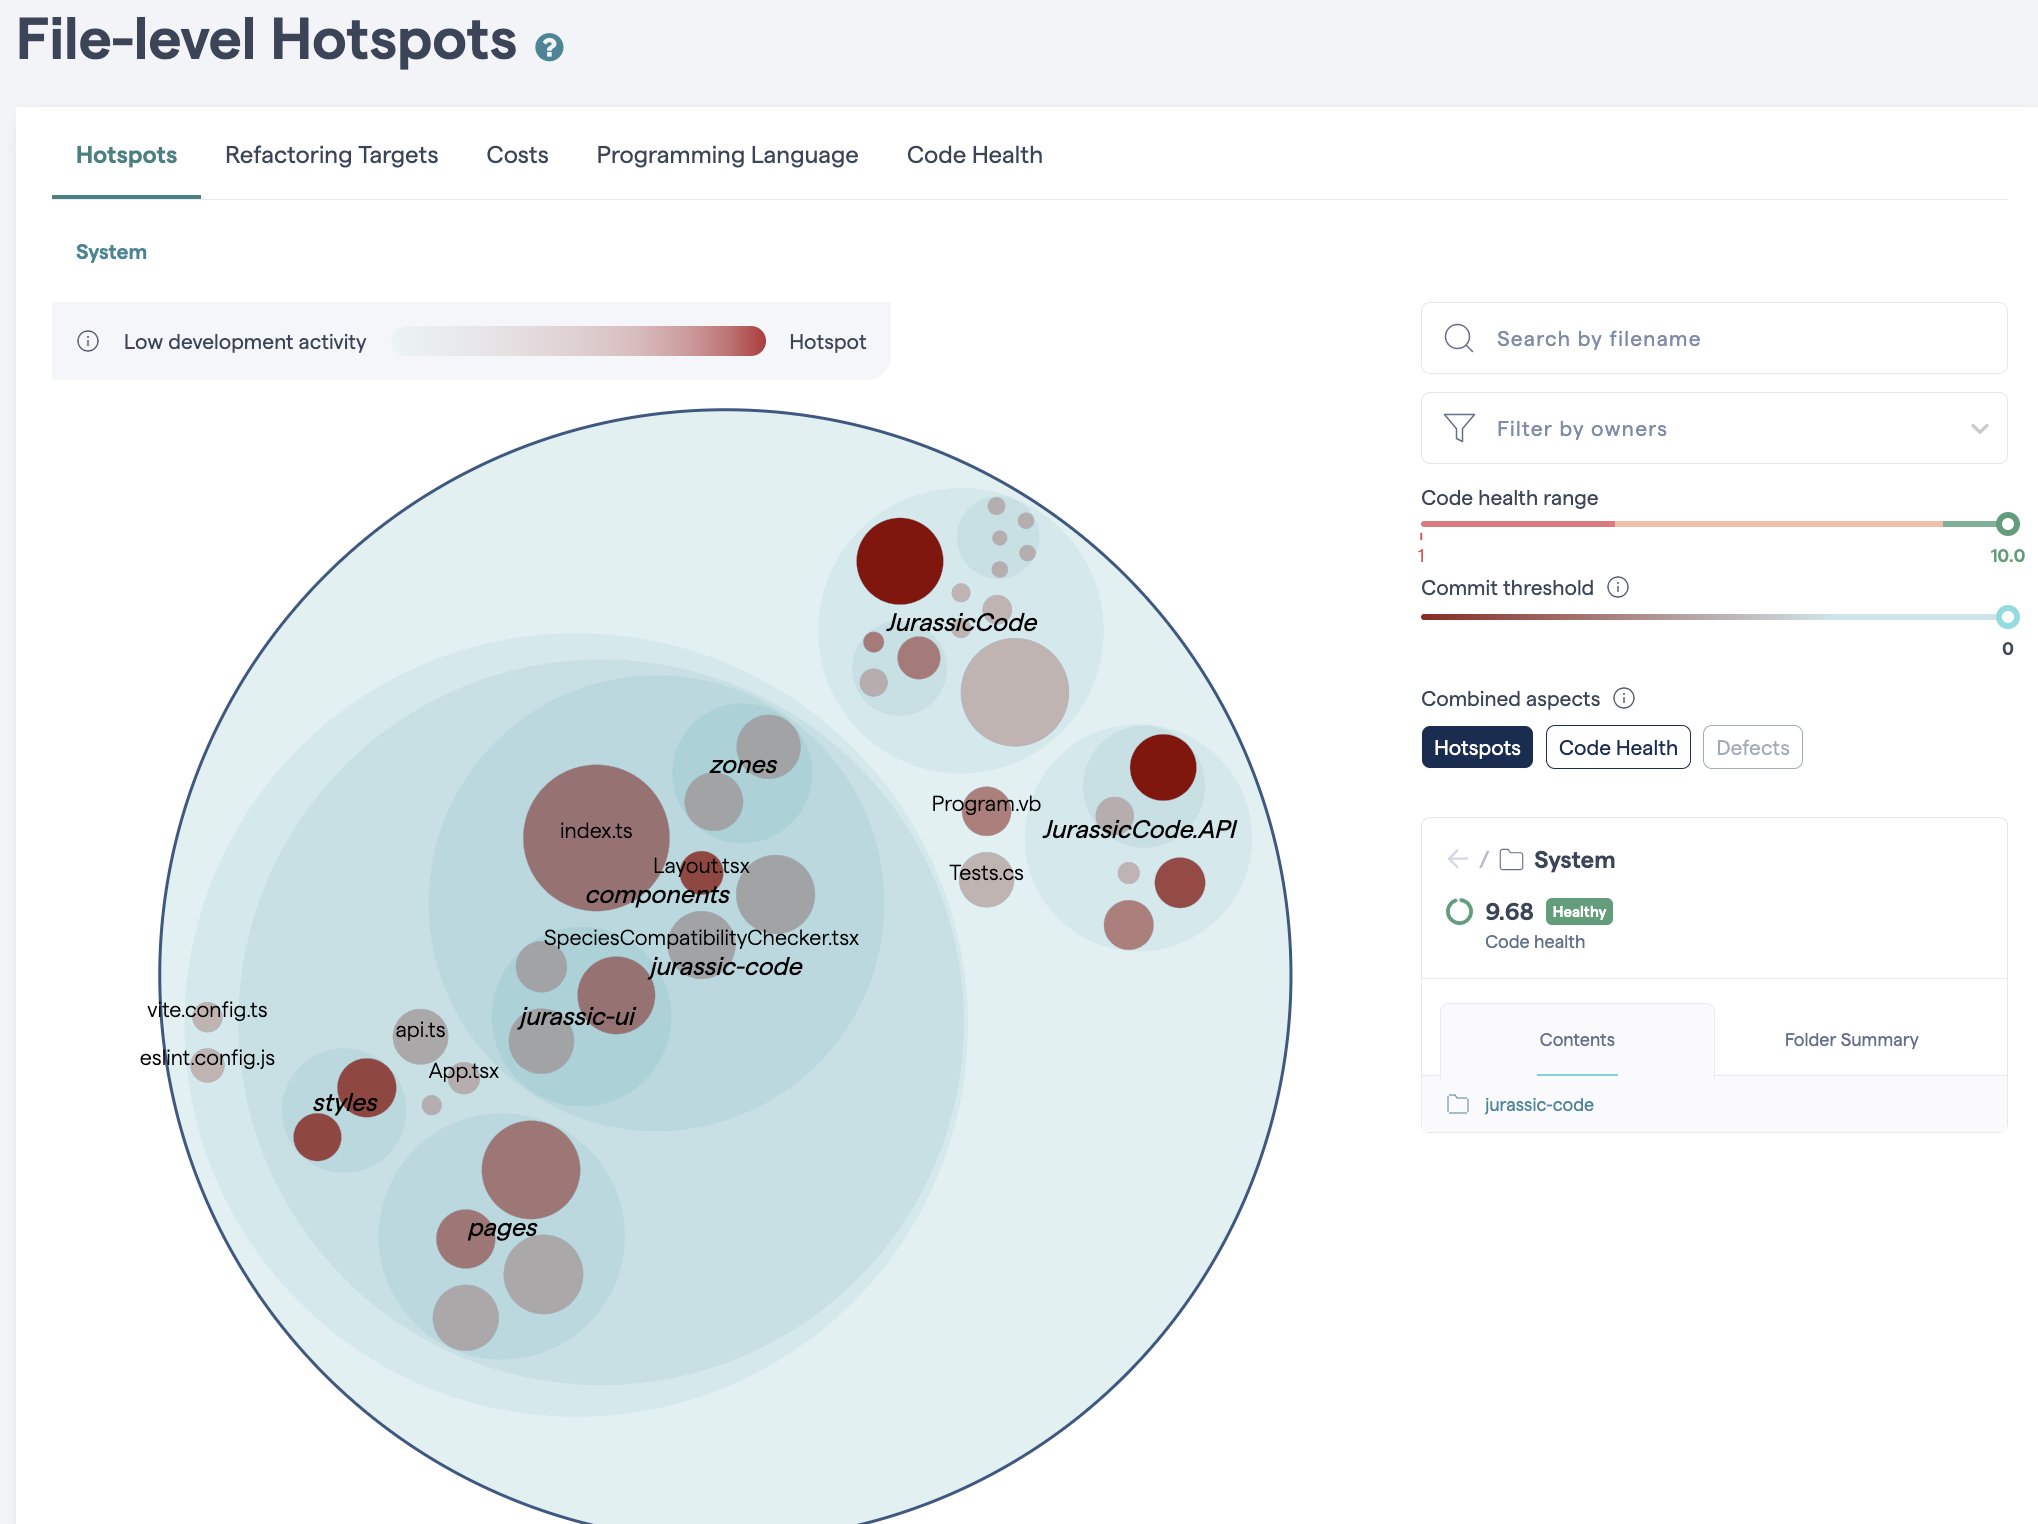
- The biggest file is
index.ts(front-end root), - The main hotspot is
Class1.cs— not a good sign, especially with such a generic name.
A poorly named, complex, and central file? That's a classic hotspot signal.
Refactoring Targets
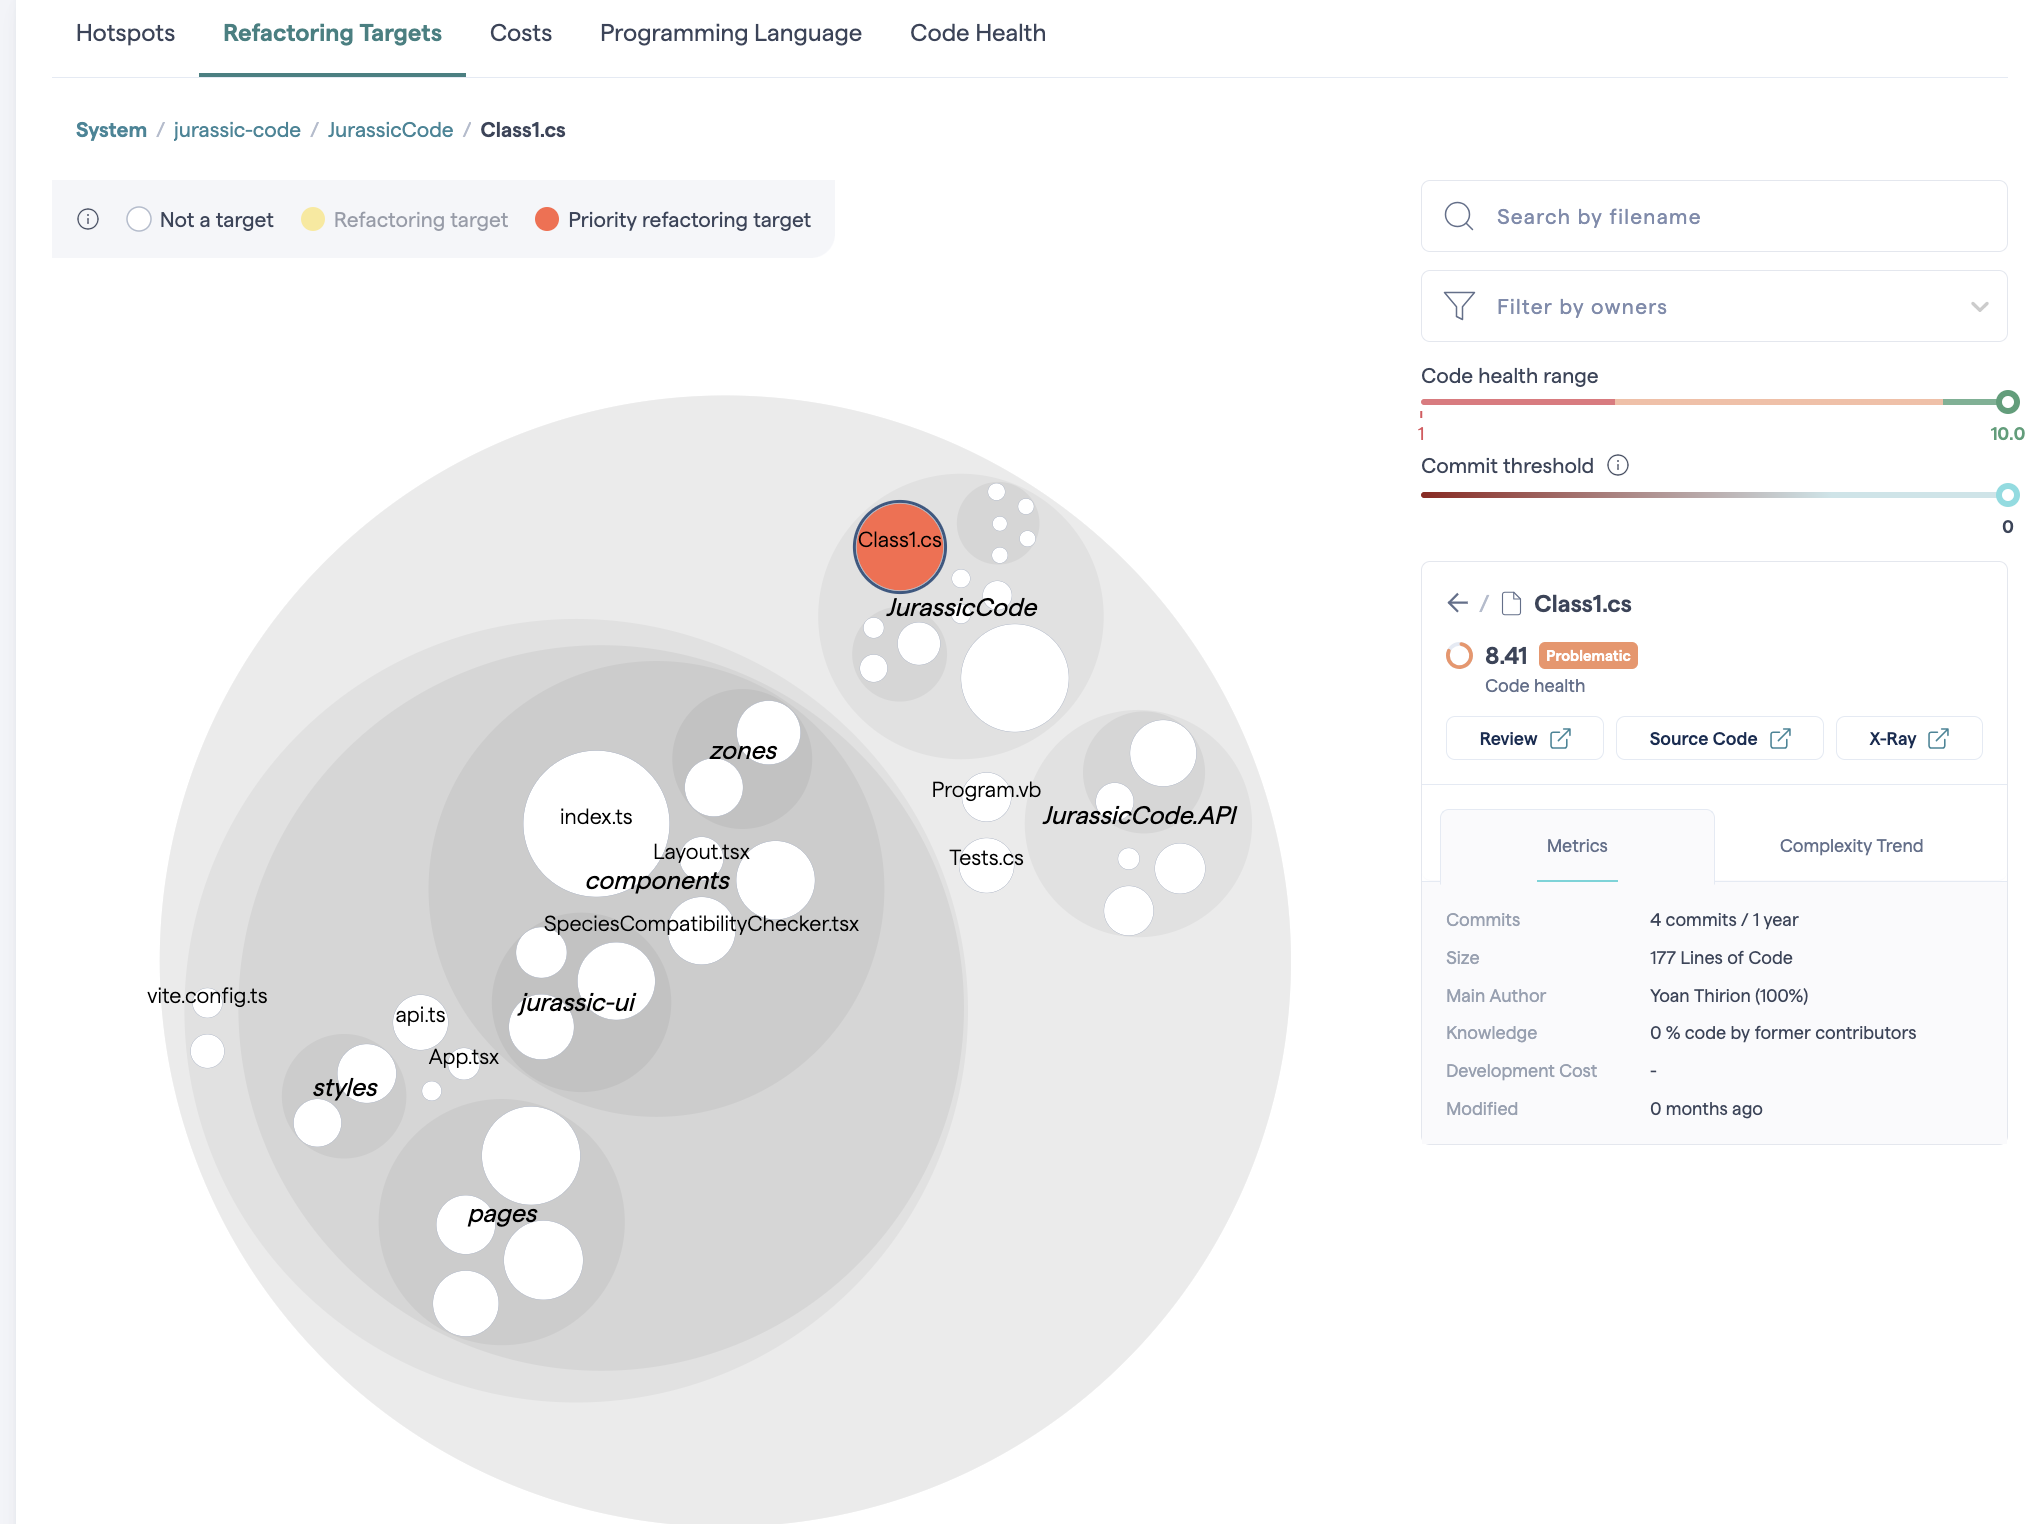
CodeScene also marks Class1.cs as a refactoring target, due to:
- Structural problems:
Bumpy Road: deeply nested conditionals,Deep Nested Complexity: control structures inside control structures.
- Warnings:
Many Conditionals,Complex Method— cyclomatic complexity > 9.
Knowledge Risks
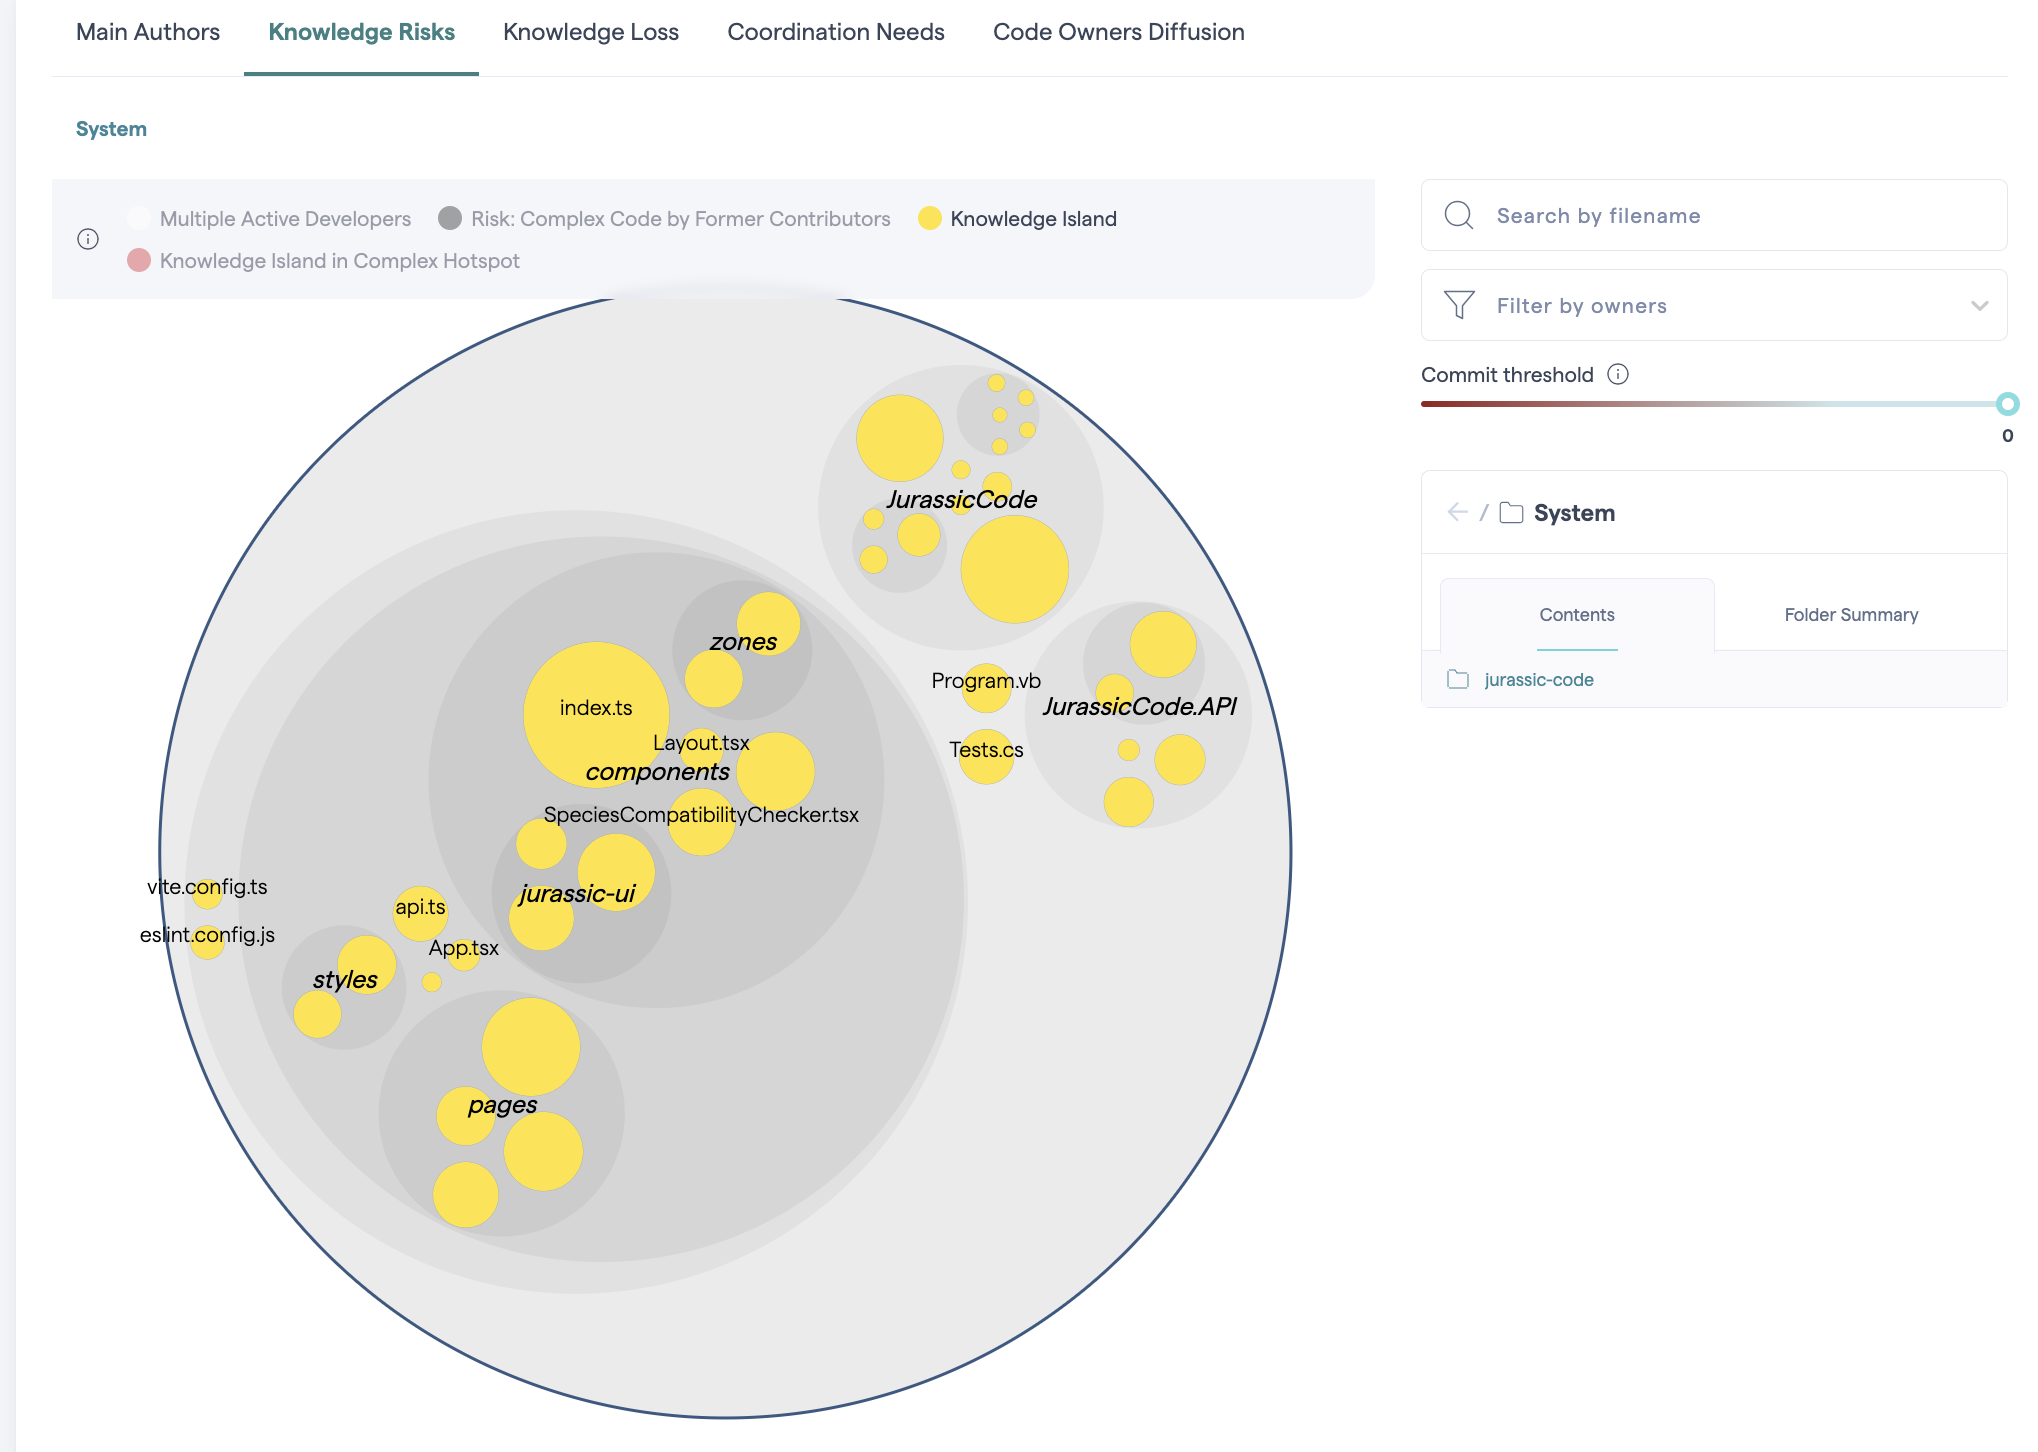
CodeScene also revealed that all modules are “knowledge islands” — meaning only one developer has worked on each:
This creates a high bus factor risk — if that person leaves, knowledge leaves with them.
Summary
Hotspots aren’t just ugly code — they’re costly code.
They concentrate bugs, create onboarding pain, and slow down development.
Behavioral code analysis helps you:
- Prioritize what to improve first,
- Focus your refactoring where it will matter most,
- Identify where pair programming or documentation efforts should be concentrated.
Deep Dive into a Hotspot: AddDinosaurToZone
Let’s now take a closer look at one of the identified hotspots.
Below is an example from the codebase — annotated to highlight common code smells and problematic patterns.
public void AddDinosaurToZone(string zoneName, Dinosaur dinosaur)
{
    bool zoneFound = false;

    // Imperative iteration with index access on a Dictionary
    // Using i + ElementAt on a Dictionary implies the wrong data structure for the operation
    // This also makes the code harder to read and more error-prone
    for (int i = 0; i < DataAccessLayer._db.Zones.Count; i++)
    {
        // Deep nesting and compound condition
        // Conditions are long and hard to reason about...
        if (DataAccessLayer._db.Zones.ElementAt(i).Value.ZoneCode == zoneName &&
            DataAccessLayer._db.Zones.ElementAt(i).Value.AccessStatus == true)
        {
            // Code Smell: Data transformation logic inline
            // This entire block could be extracted into a separate method or factory
            // Not the responsibility of this class to make Object-to-Object mapping...
            var dinosaurEntity = new Entities.DinosaurEntity
            {
                CodeName = dinosaur.Name,
                Species = dinosaur.Species,
                IsVegan = !dinosaur.IsCarnivorous, // Inversion logic adds cognitive load
                HealthStatus = dinosaur.IsSick ? "Sick" : null, // Harcoded value
                FeedingTime = dinosaur.LastFed
            };

            // Static / Wired / Hidden dependency (DataAccessLayer)
            // Hard to test, violates Dependency Inversion Principle
            DataAccessLayer.SaveDinosaur(zoneName, dinosaurEntity);

            zoneFound = true;
            break;
        }
    }

    // Control flow flag (`zoneFound`) + exception for expected case
    // This would be clearer as an early return or dictionary lookup
    if (!zoneFound)
    {
        throw new Exception("Zone is closed or does not exist.");
    }
}
Outside-In Conclusion
This Outside-In review gave us a pretty clear picture of the codebase's state — and it’s not exactly a walk in the park.
Here’s what we uncovered:
- A back-end filled with structural and architectural issues,
- Deprecated technologies (
netcoreapp3.1, goodbye support and security), - Outdated dependencies — almost 42 libyears of technical debt,
- A mountain of code smells and duplicated logic,
- Messy concern boundaries: unclear ownership, vague naming, poor modularity,
- Unreliable test suite: poor mutation scores, vague test intent, brittle assertions,
- VB.NET lurking in the shadows...
In other words: a system that may run, but is not safe to change.
My Thoughts on Outside-In Discovery
It gives you a fast, structured way to:
- Assess the
healthof a codebase, - Build a
mental modelwithout diving blindly, - Spot
red flagsbefore you waste hours down the wrong rabbit hole, - Guide your next steps — whether that’s refactoring, improving tests, or simply walking away.
Reading code is a skill. Developing reflexes to do it well is a superpower.
So next time you're dropped into an unknown codebase, take a breath — and start from the outside.
Outside-In Discovery Checklist
The checklist above reflects my personal approach, developed through hands-on work.
But here's the key insight:
You don’t need to copy it. You need to shape your own.
Every team, tech stack, and context is different.
So while this can be your starting point, I strongly encourage you to:
- Adapt it to your reality,
- Add steps that matter in your ecosystem (e.g. infrastructure, security, Green IT, UX),
- Remove what feels irrelevant,
- And continuously refine it as you encounter new codebases.
## Outside-In Discovery

Use this checklist as a structured, time-boxed way (≈1 hour) to explore any new codebase.

### Read the `README` / Related Documentation
- [ ] Does a `README.md` exist?
- [ ] Is there documentation on how to run / understand the system?
- [ ] Are architectural decisions or domain concepts explained?
- [ ] If missing: what questions remain unanswered?

### Inspect CI/CD Pipelines
- [ ] Is there a `.github/workflows/`, `.gitlab-ci.yml`, or similar CI config?
- [ ] Are builds/tests automatically triggered on push or PR?
- [ ] Are releases/deployments automated?
- [ ] Are quality gates configured (tests, linting, security checks)?
- [ ] What is the feedback loop duration?

> CI/CD tells you how code gets validated, tested, and delivered — and how confident the team is in their process.

### Inspect the Git History
- [ ] Run `git log --oneline` and scroll through:
  - [ ] Are commit messages meaningful?
  - [ ] Is the activity recent? Regular?
- [ ] Look for signs of churn or abandoned features

### Compile the Code
- [ ] Can the system be built and executed?
- [ ] Are there build scripts or automated setup steps?
- [ ] Any blockers or friction during installation?
- [ ] First impression: does the system "welcome" a new dev?

#### Analyze Compilation Warnings
- [ ] Any deprecated technologies or unsupported frameworks?
- [ ] Security vulnerabilities flagged during install or build?
- [ ] Language diversity or stack complexity (e.g. C#, VB.NET, JS)?
- [ ] Are these signals of tech debt or lack of maintenance?

### Explore the UI
- [ ] Run the app and identify its core features

### Analyze the Code Structure
- [ ] Map features to corresponding components or APIs
- [ ] Analyze folder structure: clear modularity or spaghetti?
- [ ] Look for vague naming (`Manager`, `Helper`, etc.)
- [ ] Can you identify where business logic resides?

### List and Review Dependencies
- [ ] List back-end dependencies (`dotnet list ...`)
- [ ] List front-end dependencies (`npm list --depth=0`)
- [ ] Spot integration points: APIs, DBs, brokers (Kafka, Redis…)
- [ ] Are libraries up-to-date? Secure? Maintained?

### Dependencies freshness
- [ ] Install and run `libyear`
- [ ] Check drift in dependencies:
- [ ] Prioritize critical updates if needed

### Gather Metrics (if applicable)
> ⚠️ Every project is different — some may already have tools like SonarCloud or Stryker configured.
Others may require you to install tools locally. Adapt accordingly.

- [ ] Look for existing dashboards or CI outputs (code quality gates, badges, etc.)
- [ ] Review test coverage (if reported)
  - [ ] How much is covered?
  - [ ] Are the tests meaningful?
- [ ] Check mutation testing results (if available)
- [ ] Run or review static analysis reports (SonarCloud, ESLint, etc.)
  - [ ] Code smells, bugs, complexity, duplication?

### Identify Hotspots (Behavioral Code Analysis)
Use CodeScene (or alternative) to:
- [ ] Identify complex + frequently changed files
- [ ] Spot refactoring candidates
- [ ] Visualize knowledge islands (single-author files)

### Reflect
- [ ] What would onboarding feel like on this project?
- [ ] What’s your confidence in making a change today?
- [ ] What would you improve first: documentation, tests, structure?
What would your discovery checklist look like if you tailor it?
What about AI?
Wait… no AI in this article?
I know — in a world where even your fridge has a chatbot, that might sound disappointing.
No worries — let’s explore how we can augment this practice with AI… in a coming article.
Resources


Join the conversation.