
Performance testing is an indispensable aspect of software development, ensuring that applications not only meet but exceed user expectations in varied operational conditions. These tests are pivotal in pinpointing performance bottlenecks and enhancing the overall efficiency of applications, making them robust and reliable before they reach the end-user.
This article delves into the realm of JMeter DSL.NET, a groundbreaking library that simplifies and streamlines the process of crafting comprehensive performance tests. We will explore its functionalities in-depth, from its basic usage to its advanced capabilities in testing scalability, offering insights into how this tool can be a game-changer in your performance testing strategy.
Introduction to JMeter DSL.NET
JMeter is a widely used open-source tool for load and performance testing. It is used to test the performance of web services, databases, servers, etc.
JMeter DSL.NET is an adaptation of the JMeter Java DSL, specifically targeting .NET developers.
It allows the creation of performance test plans in C# in a more intuitive and concise manner. Although the .NET version does not yet support all the features of the Java version, it covers most common use cases
Build the first performance test
The use of JMeter DSL.NET is trivial, and is currently only used to test an application's HTTP APIs. The Java version also allows communication via GraphQL, direct connection to a database or via Selenium for UI testing. It's only a matter of time before these features are ported to the .NET version.
First of all, to use this library, you'll need to define it using using static Abstracta.JmeterDsl.JmeterDsl; at the beginning of each file creating a test plan.
The test creation structure follows the following hierarchy:
- A global test plan
DslTestPlanto configure the results output format - One or more
ITestPlanChildgroups assigning threads and interations - One or more
IThreadGroupChildactions producing test content
var testStats = TestPlan(
ThreadGroup(1, 20, // Set 1 thread with 20 iterations
HttpSampler("http://localhost:5117/WeatherForecast") // Get on the API
),
// Options will go here
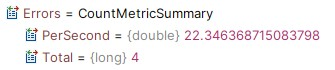
).Run(); // Starts the testRun() methods launch the test and return a TestPlanStats object containing the statistics in the Overall property of type StatsSummary to summarize the test results. All the information needed to validate test performance is present:
- Errors produced, particularly on API connections, to detect server or application unavailability
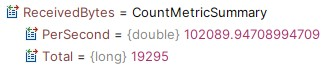
- Quantity of data exchanged to validate the load for document exchanges, for example
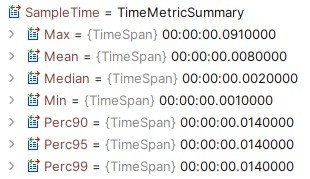
- Grouped call response times, to validate the application's SLA (Service Level Agreement) (e.g.: 99% of responses are under one second) and unit response times to determine whether extreme values are problematic
These can easily be combined with FluentAssertions to validate the results obtained:
testStats.Overall.SampleTimePercentile99.Should().BeLessThan(TimeSpan.FromSeconds(1));Plan configuration
The plan contains options for obtaining global information on test execution, in particular for debugging and exporting results.
When debugging, it is also possible to add ResultsTreeVisualizer() to activate the graphical display of results.
var stats = TestPlan(
    ThreadGroup(1, 20,
        HttpSampler("http://localhost:5117/WeatherForecast")
    ),
    ResultsTreeVisualizer()
).Run();
This feature enables the integrated View Results Tree component of JMeter, enabling the examination of both request and response details, as well as various collected metrics such as time spent, bytes sent and received, among others, for every request dispatched to the server.
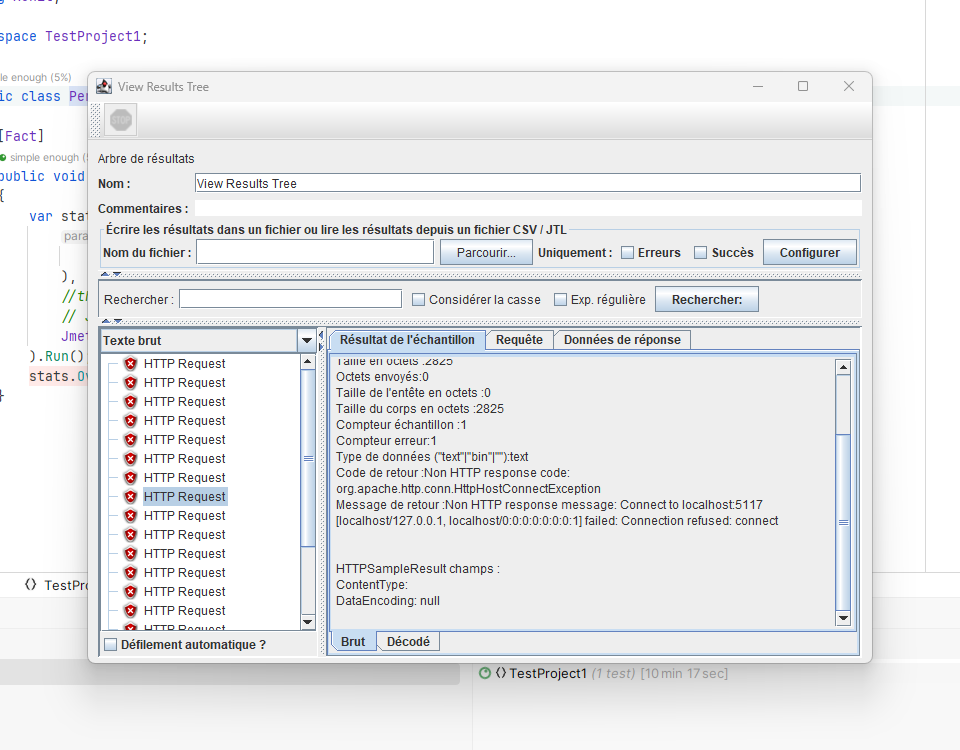
In this way, error calls are more easily visible and contain the contents of the query and response to find the origin of the problem.
Results can also be saved in .jtl format files (which are CSV files with predefined columns. To access them, simply add JtlWriter(FOLDERNAME) to the options.
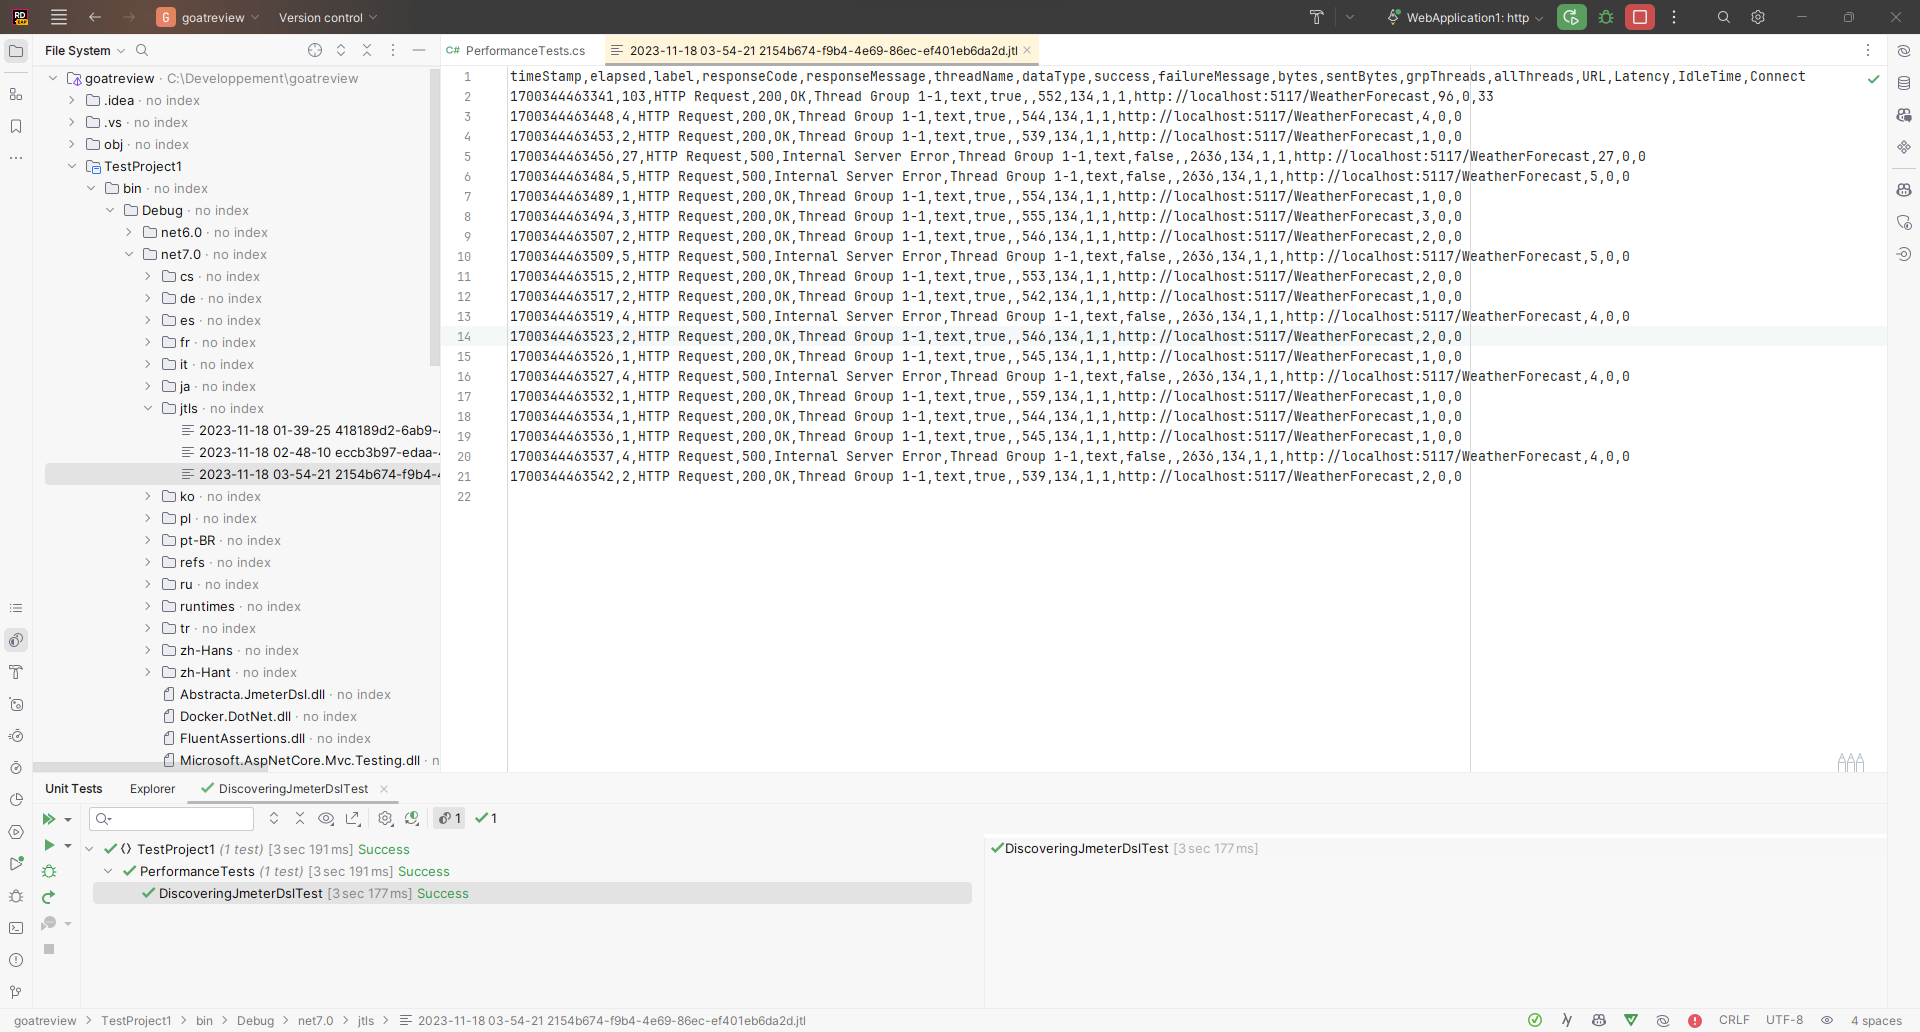
It is possible to add all the information to the file using the WithAllFields() method, but this may have an impact on performance and the resources used by the test, and therefore impact the result. Use with caution!
Threads configuration
JMeter DSL offers two straightforward methods for setting up thread groups, commonly used in various scenarios:
- Defining a specific number of threads and the iterations each thread will perform before concluding the test plan.
ThreadGroup(5, 10, ...)indicates 5 threads executing 10 iterations each. - Establishing a certain number of threads and the duration for which they will run before ending the test plan.
ThreadGroup(5, TimeSpan.FromSeconds(10), ...)signifies 5 threads operating for 10 seconds each.
Thread management is not without its side-effects, as it requires significant resources at machine level. Producing a multi-threaded test can cause a slight delay in test execution, leading to erroneous results.
To avoid this, you can delay the creation of threads for a given period of time using the RampTo() method before starting the tests.
var testStats = TestPlan(
    ThreadGroup()
        .RampTo(20, TimeSpan.FromSeconds(5)) // Go to 20 threads during 5 secs
        .Children(HttpSampler("http://localhost:5117/WeatherForecast")),
    JtlWriter("jtls")
        .RampTo(10, TimeSpan.FromSeconds(5)) // Decrease to 10 threads during 5 secs
        .Children(HttpSampler("http://localhost:5117/WeatherForecast")),
    ).Run();

testStats.Overall.SampleTimePercentile99.Should().BeLessThan(TimeSpan.FromSeconds(1));
This thread management allows you to take on more complex cases, using several calls with different numbers of threads to simulate significant load increases and observe your system's behavior.
Http configuration
Without going into too much detail, it's possible to create HTTP requests that meet the majority of simple use cases by using headers and sending data via the body or request.
var testStats = TestPlan(
    ThreadGroup(1, 20,
        HttpSampler("http://localhost:5117/WeatherForecast")
            .Method(HttpMethod.Post.Method)
            .Header("Header", "myHeader1")
            .ContentType(new MediaTypeHeaderValue(MediaTypeNames.Application.Json))
            .Body("{\"data\":\"content\"}")
    )
).Run();

testStats.Overall.SampleTimePercentile99.Should().BeLessThan(TimeSpan.FromSeconds(1));
Some of the more advanced options, such as Multipart and Authentication, are not yet available on the .NET version, so it's safe to say that they can be implemented if required.
Validate application scaling
Now that the basic functionalities of JMeter DSL.NET have been presented, it's time to focus on the benefits of performance testing.
Setting up performance tests is very time-consuming, as it requires the entire application to be deployed on an environment similar to the production environment, without which it is impossible to compare results with expectations. It is imperative that the machine on which these tests are run be the same as the production machine.
Unlike unit tests or even integration tests, performance tests are very high-level tests, which do not need to be run continuously by developers. They are ideally suited to the automated tests set up in the CI, to validate that developments have had no impact on the overall state of the system.
Before going any further, it's important to understand the limits of a CI!
A CI runs on a single machine. Running a performance test on a single machine may be limited by the machine's hardware capabilities. Using a cluster of machines can generate sufficient load to test the system.
Currently, JMeter DSL.NET offers two ways to conduct large-scale tests, with plans to expand these capabilities in the futur: Azure and BlazeMeter.
Setup Azure Load Testing
Before going any further, you'll need an Azure account to follow the rest of the example. There's a free 30-day subscription with a set number of credits, which is a good way to get started setting up these tests.
To set up your Azure account, follow this well-written guide on the subject.
Once everything's finished, you can retrieve the information you need to build the credentials you'll need for testing. You'll find some of this information in "App registrations".
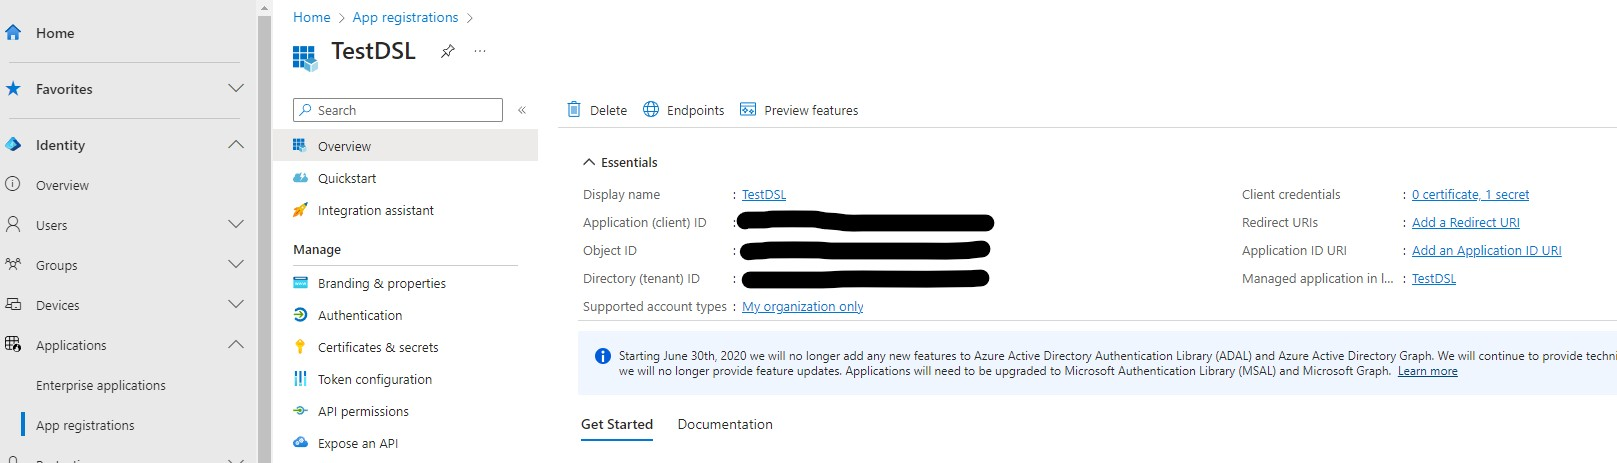
And the other by retrieving the value of the private key you're going to generate in Certificates & secrets (the value generated, not the secretId!).
All that remains is to construct it in this way to obtain a string:
var azureCredentials = "TENANTID:CLIENTID:SECRETVALUE";Test launch no longer uses the Run() method but RunIn() to declare a remote environment, in this case Azure. The name corresponds to the Azure Load Testing instance deployed on Azure.
var testStats = TestPlan(
    ThreadGroup(4, 100,
        HttpSampler("https://goatreview.com/")
    )
).RunIn(new AzureEngine(azureCredentials) //
    .TestName("dsl-test")
    .Engines(2)
    .TestTimeout(TimeSpan.FromMinutes(20)));

testStats.Overall.SampleTimePercentile99.Should().BeLessThan(TimeSpan.FromSeconds(1));
To count the number of threads that will be triggered, multiply the number of Engines by the number of threads declared in the group, here 4. There will be 8 simultaneous connections on our application. By playing with these values, you can simulate colossal numbers of connections. It is important to increase the number of threads before the number of engines, to avoid deploying too many machines (both financially and in terms of time).
Once the test has been launched, the Azure Load Testing instance should appear in the Azure interface.
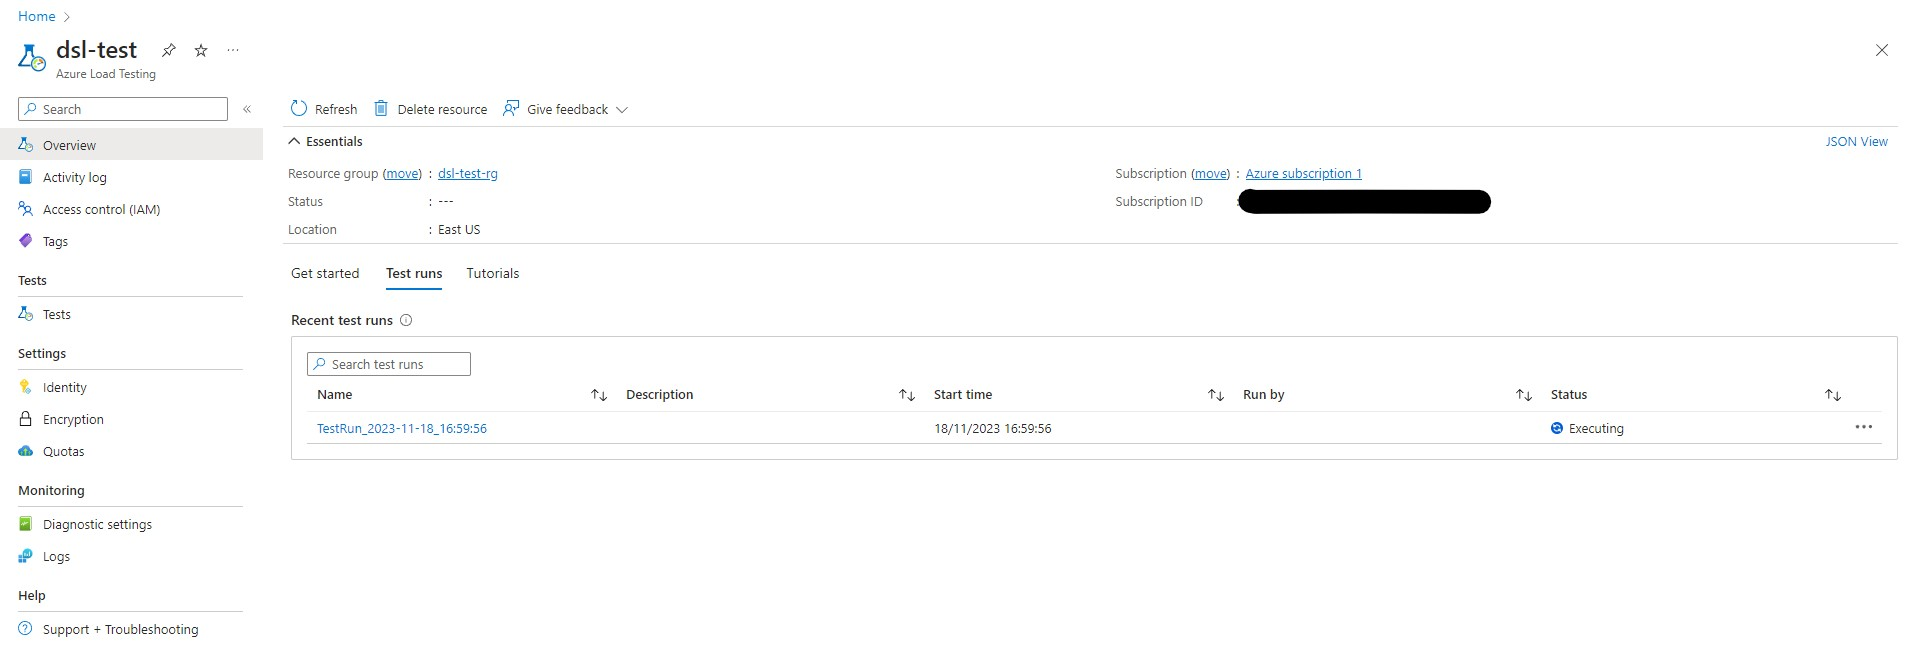
Until we get the results of the operation:
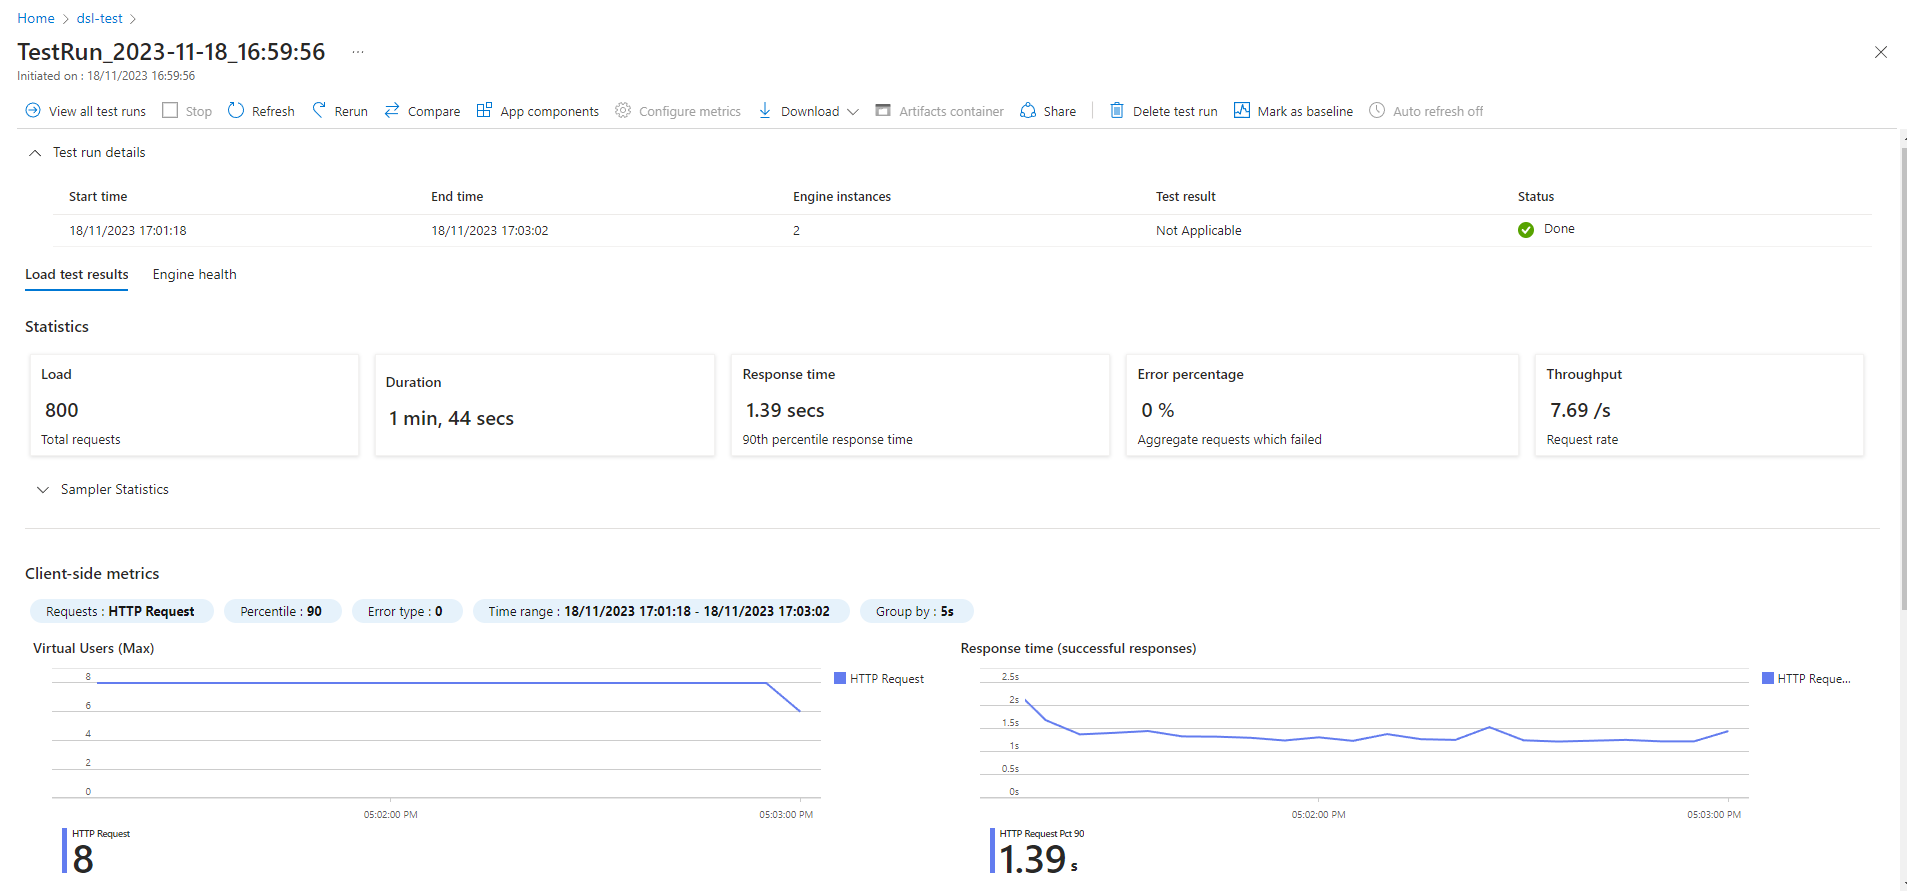
As expected, 2 machines were deployed and ran 4 threads of 100 iterations each to obtain 800 requests. The 90th percentile response time exceeded the test expectation of 1 second for the 99th percentile, triggering an error on the test side.
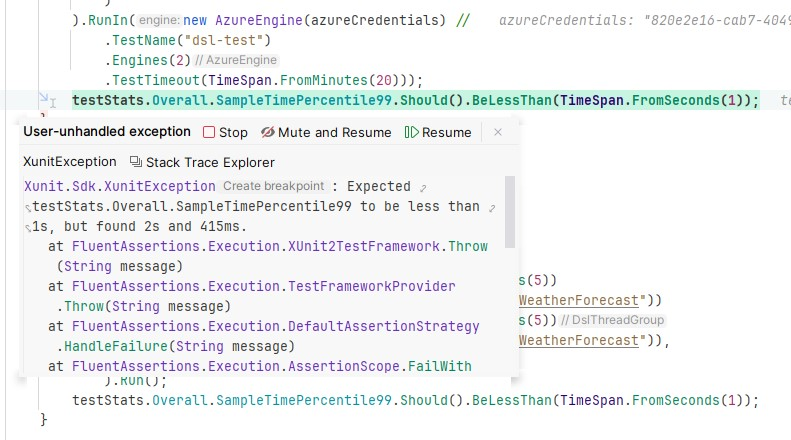
That's perfect, we've been able to validate that the application doesn't meet performance requirements!
If you ever receive errors when connecting to Azure, you can add more details by adding a file named log4j2.xml with the following content:
<?xml version="1.0" encoding="UTF-8"?>
<Configuration>
    <Appenders>
        <Console name="Console" target="SYSTEM_OUT">
            <PatternLayout pattern="%d{HH:mm:ss.SSS} [%t] %-5level %logger{36} - %msg%n"/>
        </Console>
    </Appenders>
    <Loggers>
        <Root level="INFO">
            <AppenderRef ref="Console"/>
        </Root>
        <Logger name="org.apache.jmeter" level="DEBUG"/>
        <!-- Get debug logs for Azure HTTP calls   -->
        <Logger name="us.abstracta.jmeter.javadsl.azure.AzureClient" level="DEBUG"/>
        <Logger name="okhttp3" level="DEBUG"/>
        <!-- -->
    </Loggers>
</Configuration>
A
Please note that the file name is hardcoded in the code, so don't change it.
Clean Azure Load Testing
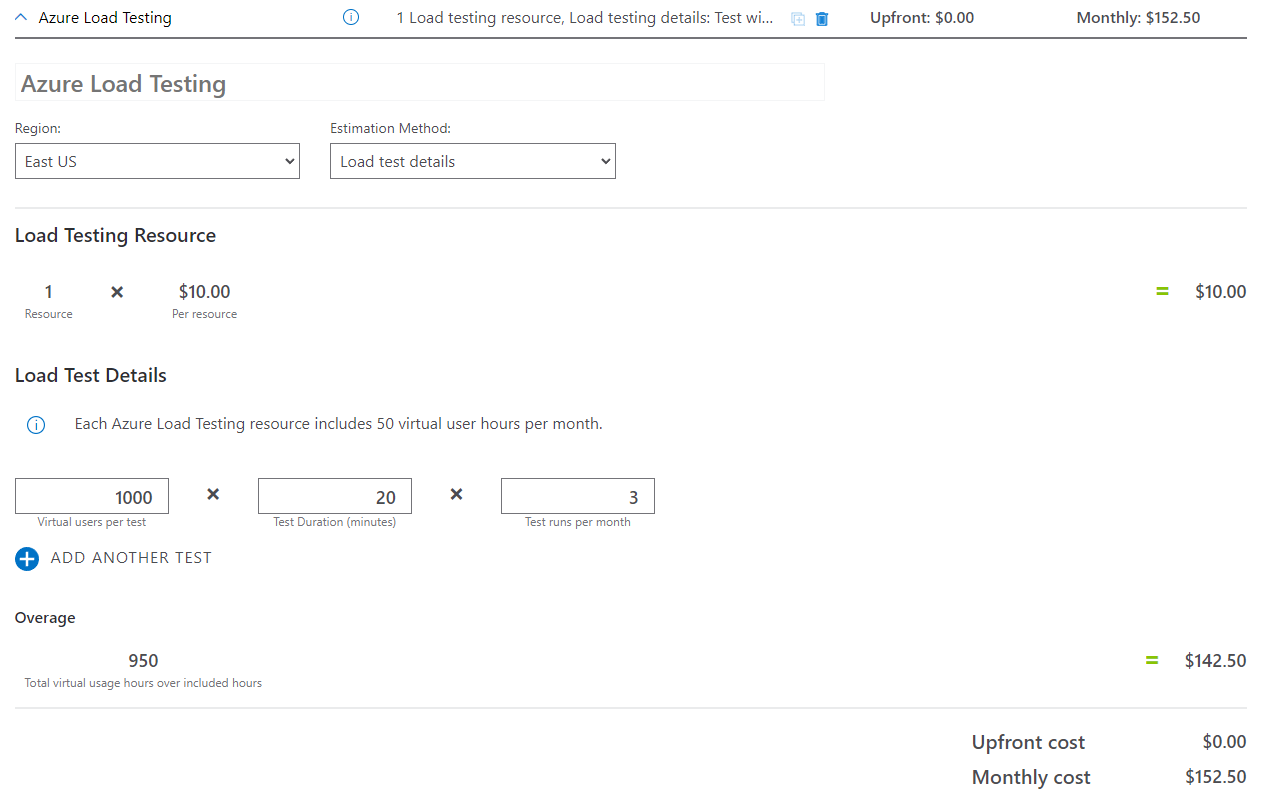
Before concluding, it's important to know that using Azure comes at a cost that you need to take into account before embarking on its use.
A fixed cost of $10 for setting up Azure Load Testing + an additional cost per use. By default, each Azure Load Testing resource includes 50 virtual user hours per month, which in our case means we can run the test with 50 users 15 times a month (if it stays under 2 minutes).
In another, more powerful case, we could imagine having 1,000 virtual users, each with 8 or 16 threads enabling us to run 100 iterations each. In total, this would mean 16,000 simultaneous connections for a total of 160,000 requests. Assuming the test lasts 20 minutes and is run 3 times a month, the total price would be $150, which is far from excessive.
Alternatively, there's a cheaper option, deployed on the Java version but not yet on .NET: remote testing.
With this option, you no longer need to use an external environment to start simultaneous connections. Simply deploy JMeter instances on a server (external or local) via Docker and use them as a test agent.
This requires more setup than a turnkey solution like Azure, but depending on your needs, can also drastically reduce costs.
Summary
In conclusion, this article has highlighted the vital role of performance testing in software development and introduced JMeter DSL.NET as a potent tool tailored for .NET developers. Throughout the article, we've explored various key aspects:
- JMeter DSL.NET's Flexibility: The tool's flexibility and convenience in creating performance test plans have been showcased, making it a valuable asset for developers.
- Coverage of Common Use Cases: While the .NET version may not have all the features of its Java counterpart, it effectively covers most common use cases, ensuring robust testing.
- Plan Configuration and Debugging: We've delved into plan configuration, debugging techniques, and result visualization, providing essential insights for effective testing practices.
- Integration and Scalability: Emphasizing the significance of performance testing in continuous integration, the article introduced Azure Load Testing as a scalable testing solution.
- Cost-Effective Testing: Considerations for cost-effective testing, including remote testing options, were discussed, helping developers optimize resources.
In essence, you now have the necessary tools and knowledge to conduct thorough performance testing, guaranteeing software reliability, and meeting user expectations.
To go further:
Have a goat day 🐐
Join the conversation.